QUESTION IMAGE
Question
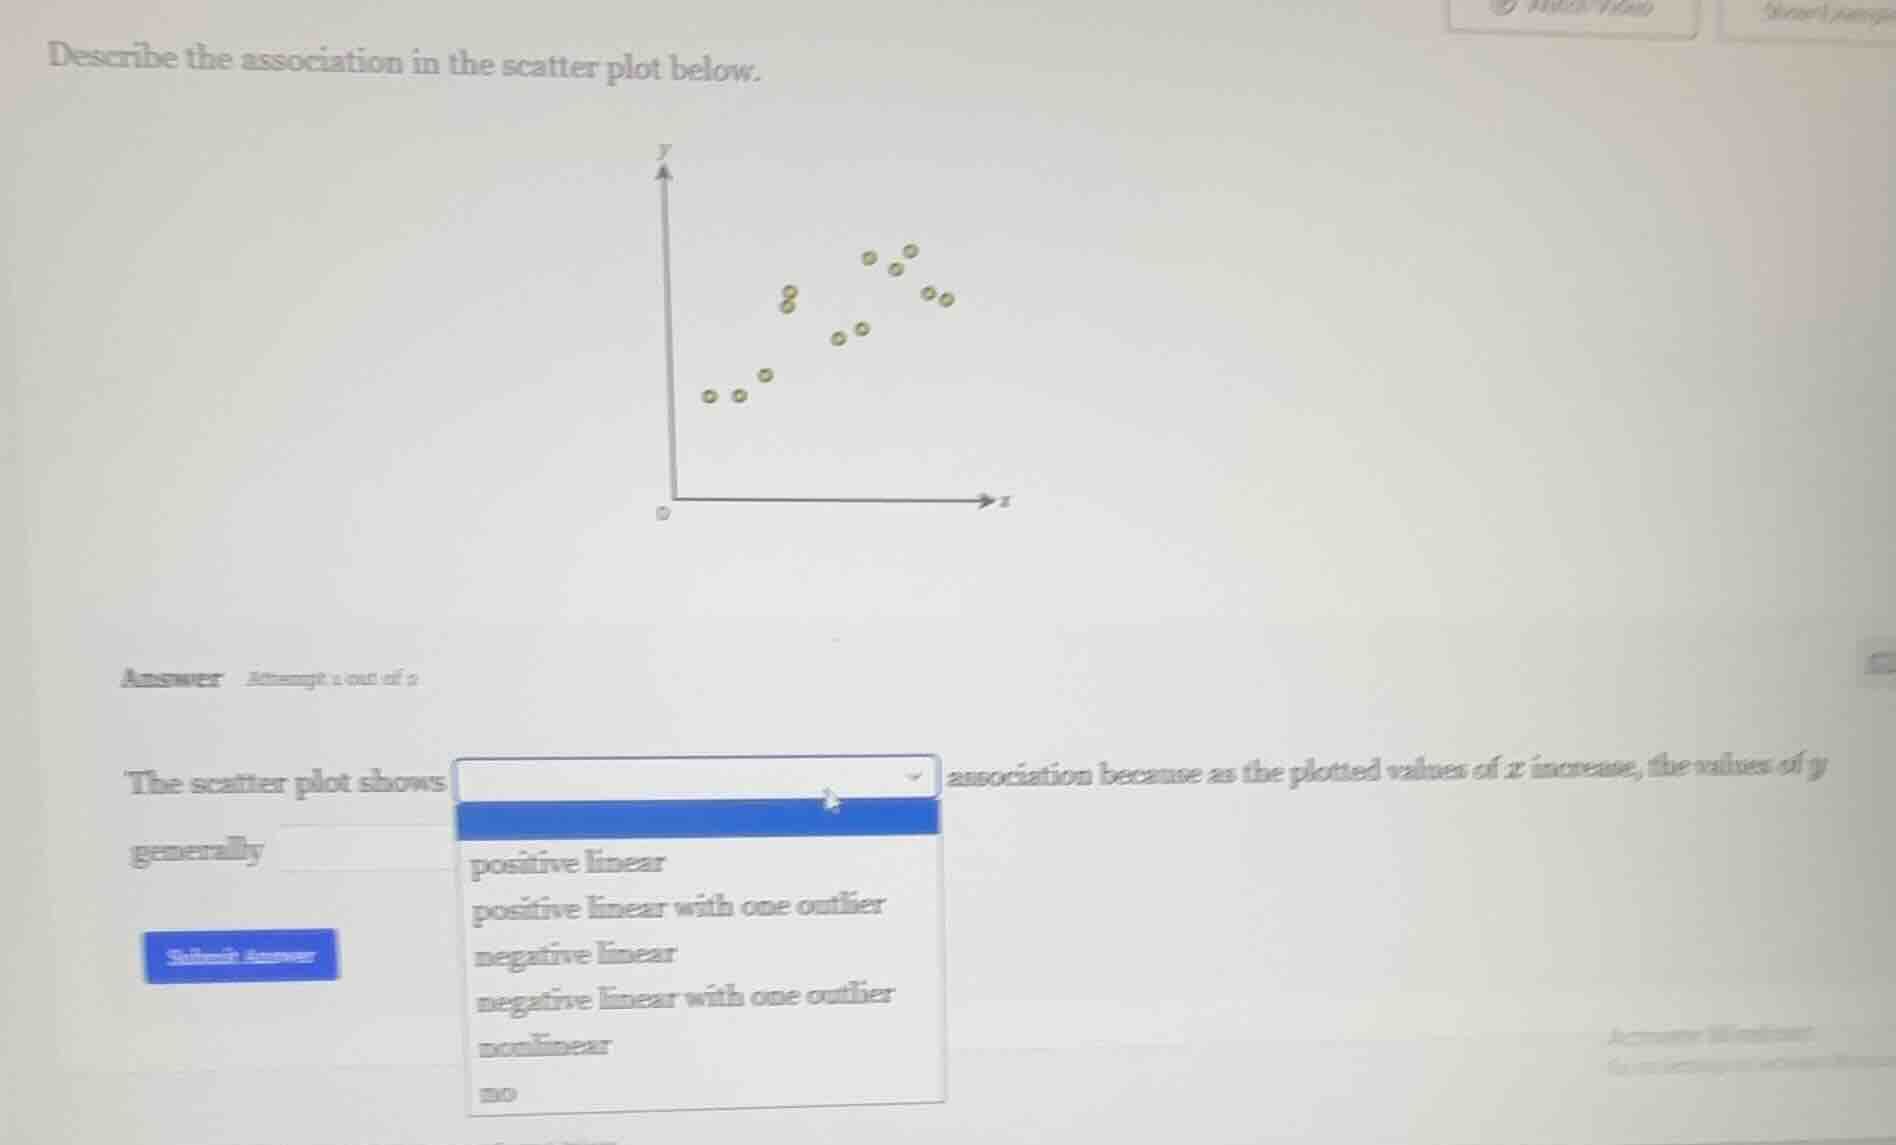
describe the association in the scatter plot below.
answer attempt 1 out of 2
the scatter plot shows association because as the plotted values of ( x ) increase, the values of ( y ) generally
options: positive linear, positive linear with one outlier, negative linear, negative linear with one outlier, nonlinear, no
First, observe the trend: as x increases, y first rises, then falls, so the pattern is not a straight line (non-linear). There is no consistent positive/negative linear trend, and no clear outlier that breaks a linear pattern; the overall shape curves, fitting a nonlinear association.

Snap & solve any problem in the app
Get step-by-step solutions on Sovi AI
Photo-based solutions with guided steps
Explore more problems and detailed explanations
nonlinear