QUESTION IMAGE
Question
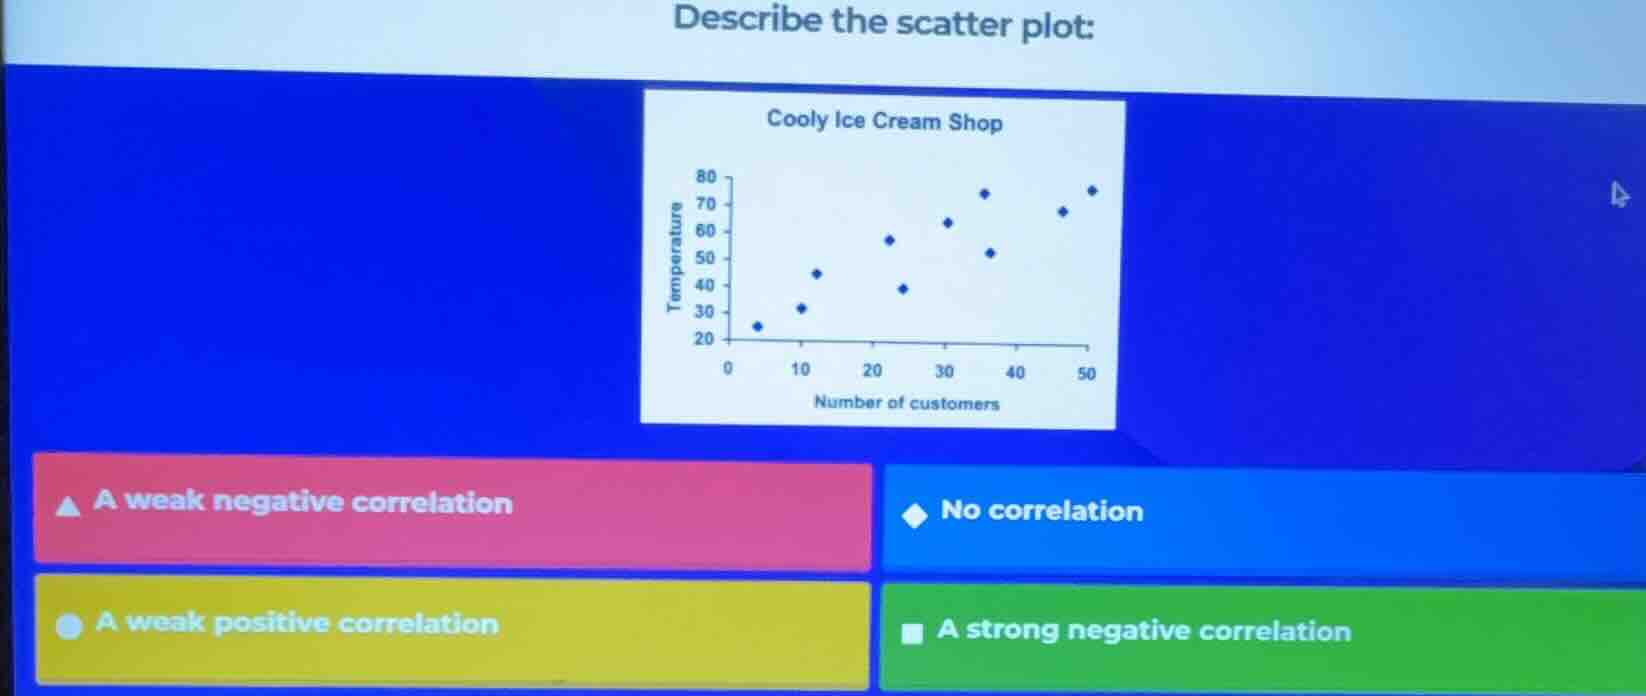
describe the scatter plot:
cooly ice cream shop
a weak negative correlation
no correlation
a weak positive correlation
a strong negative correlation
To determine the correlation, we analyze the scatter plot. As the number of customers (x - axis) increases, the temperature (y - axis) generally increases. The points show an upward trend but are not perfectly aligned, indicating a weak positive correlation. A weak negative correlation would show a downward trend, no correlation has random points, and a strong negative correlation has a clear downward trend. So the correct description is a weak positive correlation.

Snap & solve any problem in the app
Get step-by-step solutions on Sovi AI
Photo-based solutions with guided steps
Explore more problems and detailed explanations
A. A weak negative correlation
B. No correlation
C. A weak positive correlation
D. A strong negative correlation
C. A weak positive correlation