QUESTION IMAGE
Question
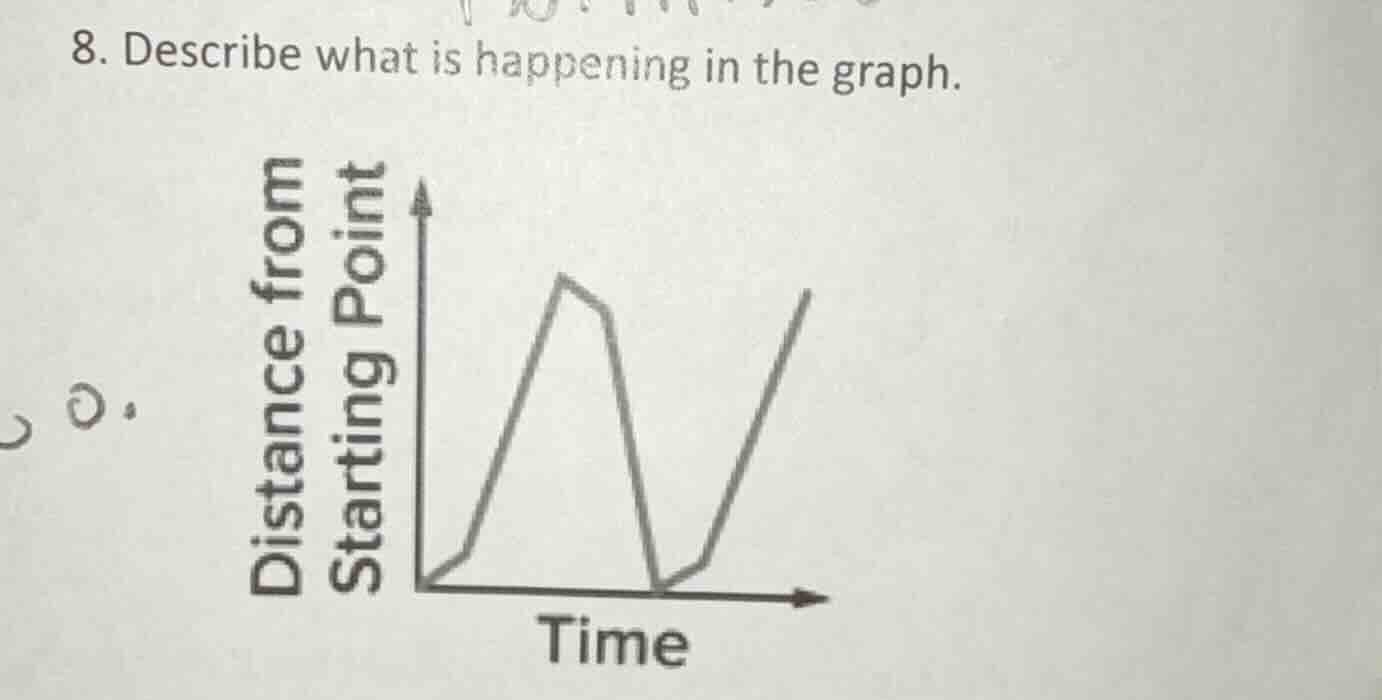
- describe what is happening in the graph.
distance from starting point
time
The graph has time on the x - axis and distance from the starting point on the y - axis. Initially, the distance increases (moving away from the start), then decreases (moving back towards the start, maybe with a small pause or slower movement at one point), reaches zero (back at the start), then increases again (moving away from the start once more).

Snap & solve any problem in the app
Get step-by-step solutions on Sovi AI
Photo-based solutions with guided steps
Explore more problems and detailed explanations
The object starts at the starting point. It first moves away from the starting point (distance increases with time), then moves back towards the starting point (distance decreases) until it reaches the starting point (distance is 0). After that, it moves away from the starting point again (distance increases with time). There are also some changes in the rate of movement (like a possible brief slowdown or pause) during the first outward and return trips.