QUESTION IMAGE
Question
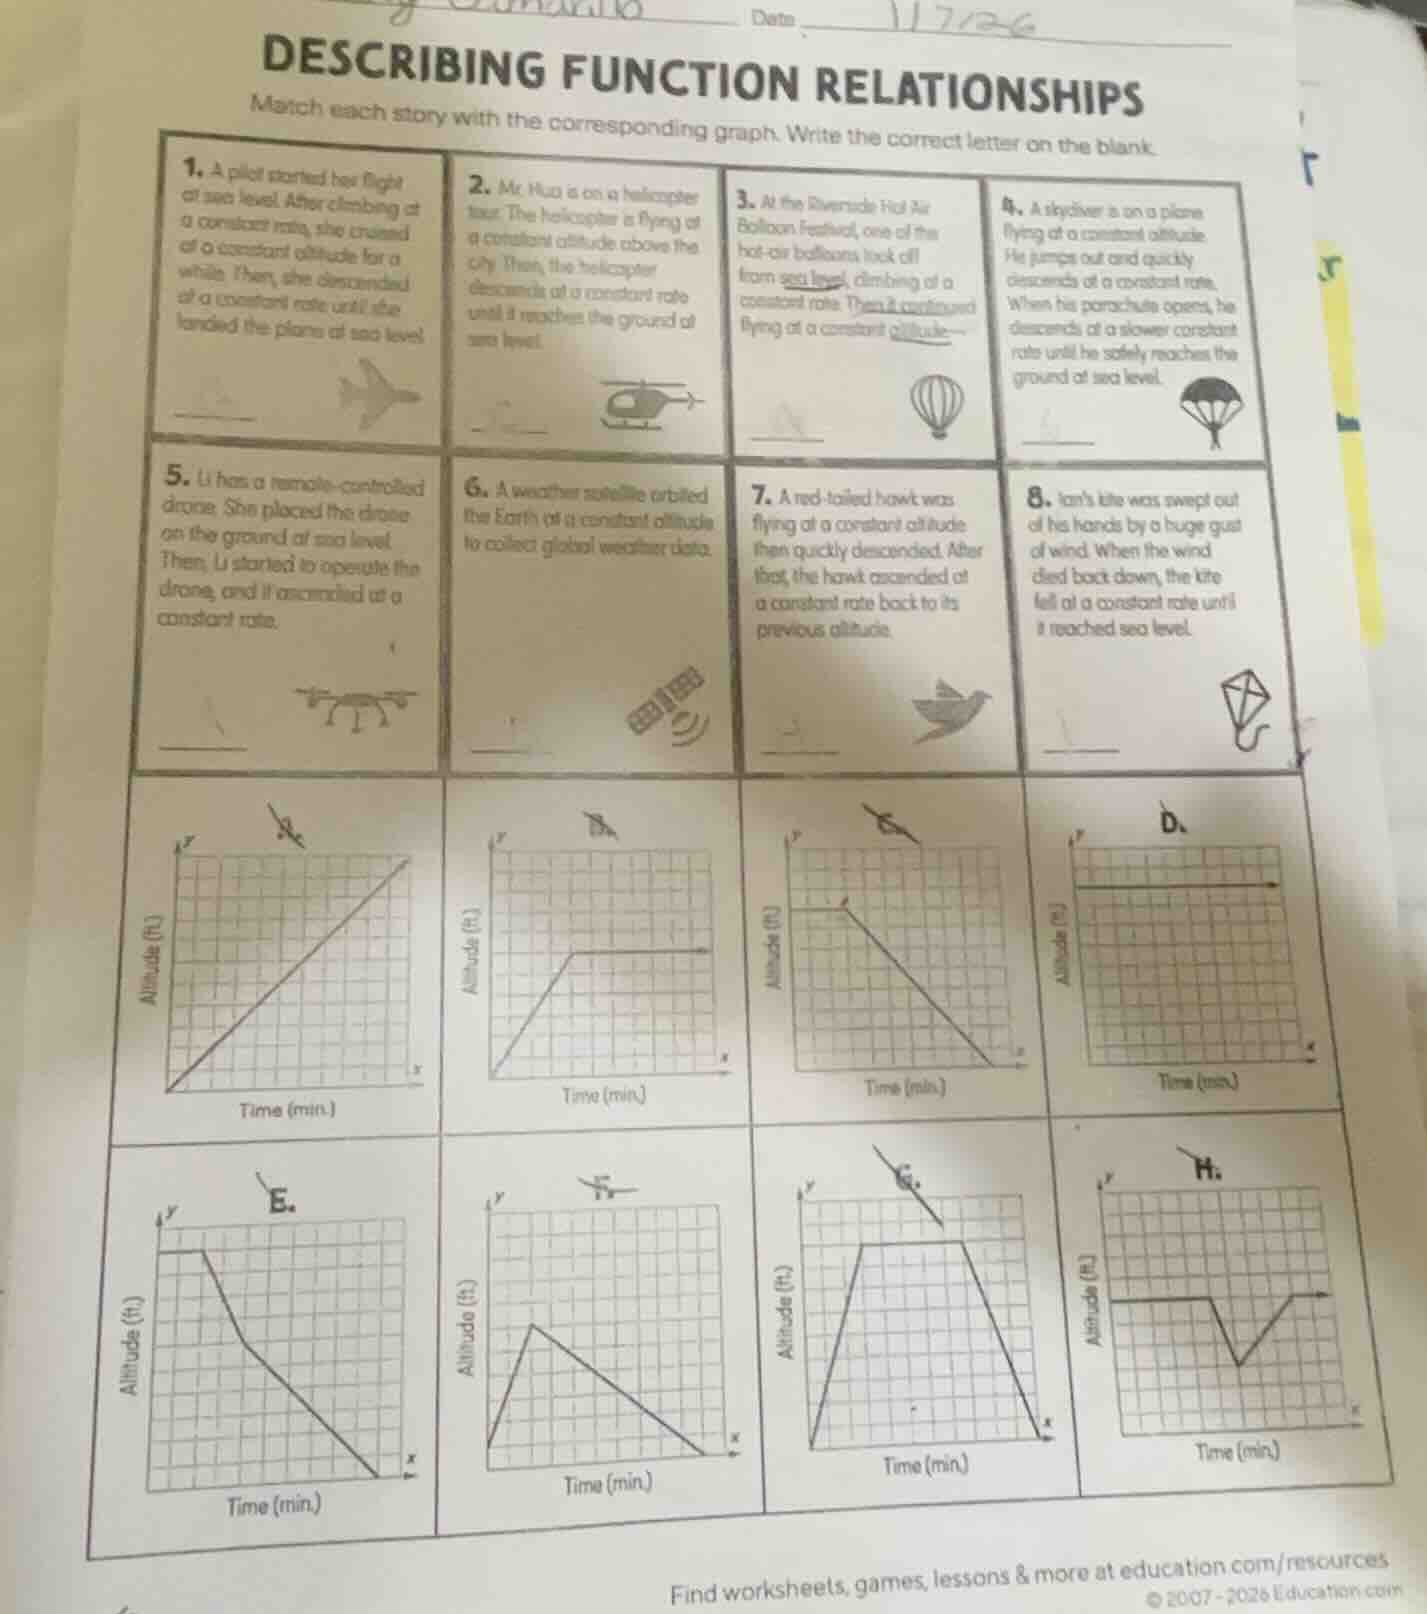
describing function relationships
match each story with the corresponding graph. write the correct letter on the blank.
- a pilot started her flight at sea level. after climbing at a constant rate, she cruised at a constant altitude for a while. then, she descended at a constant rate until she landed the plane at sea level
- mr. nuo is on a helicopter tour. the helicopter is flying at a constant altitude above the city. then, the helicopter descends at a constant rate until it reaches the ground at sea level.
- at the riverside hot air balloon festival, one of the hot - air balloons took off from sea level, climbing at a constant rate. then it continued flying at a constant altitude.
- a sky diver is on a plane flying at a constant altitude. he jumps out and quickly descends at a constant rate. when his parachute opens, he descends at a slower constant rate until he safely reaches the ground at sea level.
- li has a remote - controlled drone. she placed the drone on the ground at sea level. then, li started to operate the drone, and it ascended at a constant rate.
- a weather satellite orbited the earth at a constant altitude to collect global weather data.
- a red - tailed hawk was flying at a constant altitude then quickly descended. after that, the hawk ascended at a constant rate back to its previous altitude.
- ians kite was swept out of his hands by a huge gust of wind. when the wind died back down, the kite fell at a constant rate until it reached sea level.
(there are also several graphs with labels like a, d, e, f, g, h, etc. showing the relationship between altitude (ft) and time (min))
To solve this problem, we analyze each story and match it with the corresponding graph based on the description of altitude (y - axis) vs. time (x - axis) behavior:
1. Pilot's Flight
- Story: Starts at sea level (altitude = 0), climbs at constant rate (altitude increases linearly), flies at constant altitude (horizontal line), then descends at constant rate to sea level (altitude decreases linearly to 0).
- Graph Match: Graph G (has a rise, a horizontal segment, then a fall to 0).
2. Helicopter Tour
- Story: Flies at constant altitude (horizontal line), then descends at constant rate to sea level (altitude decreases linearly to 0).
- Graph Match: Graph E (starts with a horizontal segment, then a linear fall to 0).
3. Hot - air Balloon
- Story: Starts at sea level (altitude = 0), climbs at constant rate (altitude increases linearly), then flies at constant altitude (horizontal line).
- Graph Match: Graph B (has a linear rise, then a horizontal segment).
4. Skydiver
- Story: Flies at constant altitude (horizontal line), quickly descends (steep linear fall), then descends at a slower constant rate (less steep linear fall) to sea level.
- Graph Match: Graph H (horizontal segment, steep fall, less steep fall to 0).
5. Remote - controlled Drone
- Story: Starts at sea level (altitude = 0), ascends at constant rate (altitude increases linearly).
- Graph Match: Graph A (linear rise from 0).
6. Weather Satellite
- Story: Orbits at constant altitude (horizontal line, since altitude doesn't change with time).
- Graph Match: Graph D (horizontal line, constant altitude).
7. Red - tailed Hawk
- Story: Flies at constant altitude (horizontal line), quickly descends (steep linear fall), then ascends at constant rate back to previous altitude (linear rise back to original horizontal level).
- Graph Match: Graph F (horizontal segment, steep fall, then linear rise back to horizontal).
8. Ian's Kite
- Story: Swept out (altitude increases quickly, but the graph options: starts, then falls at constant rate to sea level. Wait, the kite was swept out (altitude rises? But the graphs: Let's re - check. The kite was swept out, then when wind died, it fell at constant rate to sea level. Wait, maybe I misread. The kite was swept out (so altitude goes up? But the given graphs: Let's see, the story says "when the wind died back down, the kite fell at a constant rate until it reached sea level". So it starts, maybe at some altitude, then falls. Wait, maybe the kite was at sea level, swept up (altitude rises), then falls? But the graphs: Graph C: Let's check again. Wait, the kite story: "Ian's kite was swept out of his hands by a huge gust of wind. When the wind died back down, the kite fell at a constant rate until it reached sea level." So it goes from sea level (or initial altitude), is swept up (altitude increases), then falls at constant rate to sea level. But looking at the graphs, Graph C: has a rise, then a fall? Wait no, the graphs: Let's list the graphs:
Graphs:
- A: Linear rise from 0.
- B: Rise, then horizontal.
- C: Linear fall from a height to 0.
- D: Horizontal line.
- E: Horizontal, then fall.
- F: Horizontal, fall, rise.
- G: Rise, horizontal, fall.
- H: Horizontal, steep fall, less steep fall.
Wait, maybe the kite starts at sea level, is swept up (so altitude increases), then falls at constant rate to sea level. But none of the graphs have a rise then fall? Wait, maybe the kite was at sea level, and when swept out, it goes up, then falls. But…

Snap & solve any problem in the app
Get step-by-step solutions on Sovi AI
Photo-based solutions with guided steps
Explore more problems and detailed explanations
To solve this problem, we analyze each story and match it with the corresponding graph based on the description of altitude (y - axis) vs. time (x - axis) behavior:
1. Pilot's Flight
- Story: Starts at sea level (altitude = 0), climbs at constant rate (altitude increases linearly), flies at constant altitude (horizontal line), then descends at constant rate to sea level (altitude decreases linearly to 0).
- Graph Match: Graph G (has a rise, a horizontal segment, then a fall to 0).
2. Helicopter Tour
- Story: Flies at constant altitude (horizontal line), then descends at constant rate to sea level (altitude decreases linearly to 0).
- Graph Match: Graph E (starts with a horizontal segment, then a linear fall to 0).
3. Hot - air Balloon
- Story: Starts at sea level (altitude = 0), climbs at constant rate (altitude increases linearly), then flies at constant altitude (horizontal line).
- Graph Match: Graph B (has a linear rise, then a horizontal segment).
4. Skydiver
- Story: Flies at constant altitude (horizontal line), quickly descends (steep linear fall), then descends at a slower constant rate (less steep linear fall) to sea level.
- Graph Match: Graph H (horizontal segment, steep fall, less steep fall to 0).
5. Remote - controlled Drone
- Story: Starts at sea level (altitude = 0), ascends at constant rate (altitude increases linearly).
- Graph Match: Graph A (linear rise from 0).
6. Weather Satellite
- Story: Orbits at constant altitude (horizontal line, since altitude doesn't change with time).
- Graph Match: Graph D (horizontal line, constant altitude).
7. Red - tailed Hawk
- Story: Flies at constant altitude (horizontal line), quickly descends (steep linear fall), then ascends at constant rate back to previous altitude (linear rise back to original horizontal level).
- Graph Match: Graph F (horizontal segment, steep fall, then linear rise back to horizontal).
8. Ian's Kite
- Story: Swept out (altitude increases quickly, but the graph options: starts, then falls at constant rate to sea level. Wait, the kite was swept out (altitude rises? But the graphs: Let's re - check. The kite was swept out, then when wind died, it fell at constant rate to sea level. Wait, maybe I misread. The kite was swept out (so altitude goes up? But the given graphs: Let's see, the story says "when the wind died back down, the kite fell at a constant rate until it reached sea level". So it starts, maybe at some altitude, then falls. Wait, maybe the kite was at sea level, swept up (altitude rises), then falls? But the graphs: Graph C: Let's check again. Wait, the kite story: "Ian's kite was swept out of his hands by a huge gust of wind. When the wind died back down, the kite fell at a constant rate until it reached sea level." So it goes from sea level (or initial altitude), is swept up (altitude increases), then falls at constant rate to sea level. But looking at the graphs, Graph C: has a rise, then a fall? Wait no, the graphs: Let's list the graphs:
Graphs:
- A: Linear rise from 0.
- B: Rise, then horizontal.
- C: Linear fall from a height to 0.
- D: Horizontal line.
- E: Horizontal, then fall.
- F: Horizontal, fall, rise.
- G: Rise, horizontal, fall.
- H: Horizontal, steep fall, less steep fall.
Wait, maybe the kite starts at sea level, is swept up (so altitude increases), then falls at constant rate to sea level. But none of the graphs have a rise then fall? Wait, maybe the kite was at sea level, and when swept out, it goes up, then falls. But the given graphs: Let's check the story again. "Ian's kite was swept out of his hands by a huge gust of wind. When the wind died back down, the kite fell at a constant rate until it reached sea level." So the kite's altitude: starts at sea level (0), is swept up (altitude increases), then falls at constant rate to 0. But the graphs: Graph C is a linear fall from a height to 0. Wait, maybe I made a mistake. Wait, the kite was in his hands (at sea level), swept out (so altitude goes up), then falls. But the graphs: Let's see, the only graph with a fall from a height to 0, and no rise before? No, maybe the kite was at some altitude, then fell. Wait, maybe the correct graph for the kite is Graph C (linear fall to 0). Because the story says "fell at a constant rate until it reached sea level", so it starts at some altitude and falls linearly to 0.
Final Matches:
- \(\boldsymbol{G}\)
- \(\boldsymbol{E}\)
- \(\boldsymbol{B}\)
- \(\boldsymbol{H}\)
- \(\boldsymbol{A}\)
- \(\boldsymbol{D}\)
- \(\boldsymbol{F}\)
- \(\boldsymbol{C}\)