QUESTION IMAGE
Question
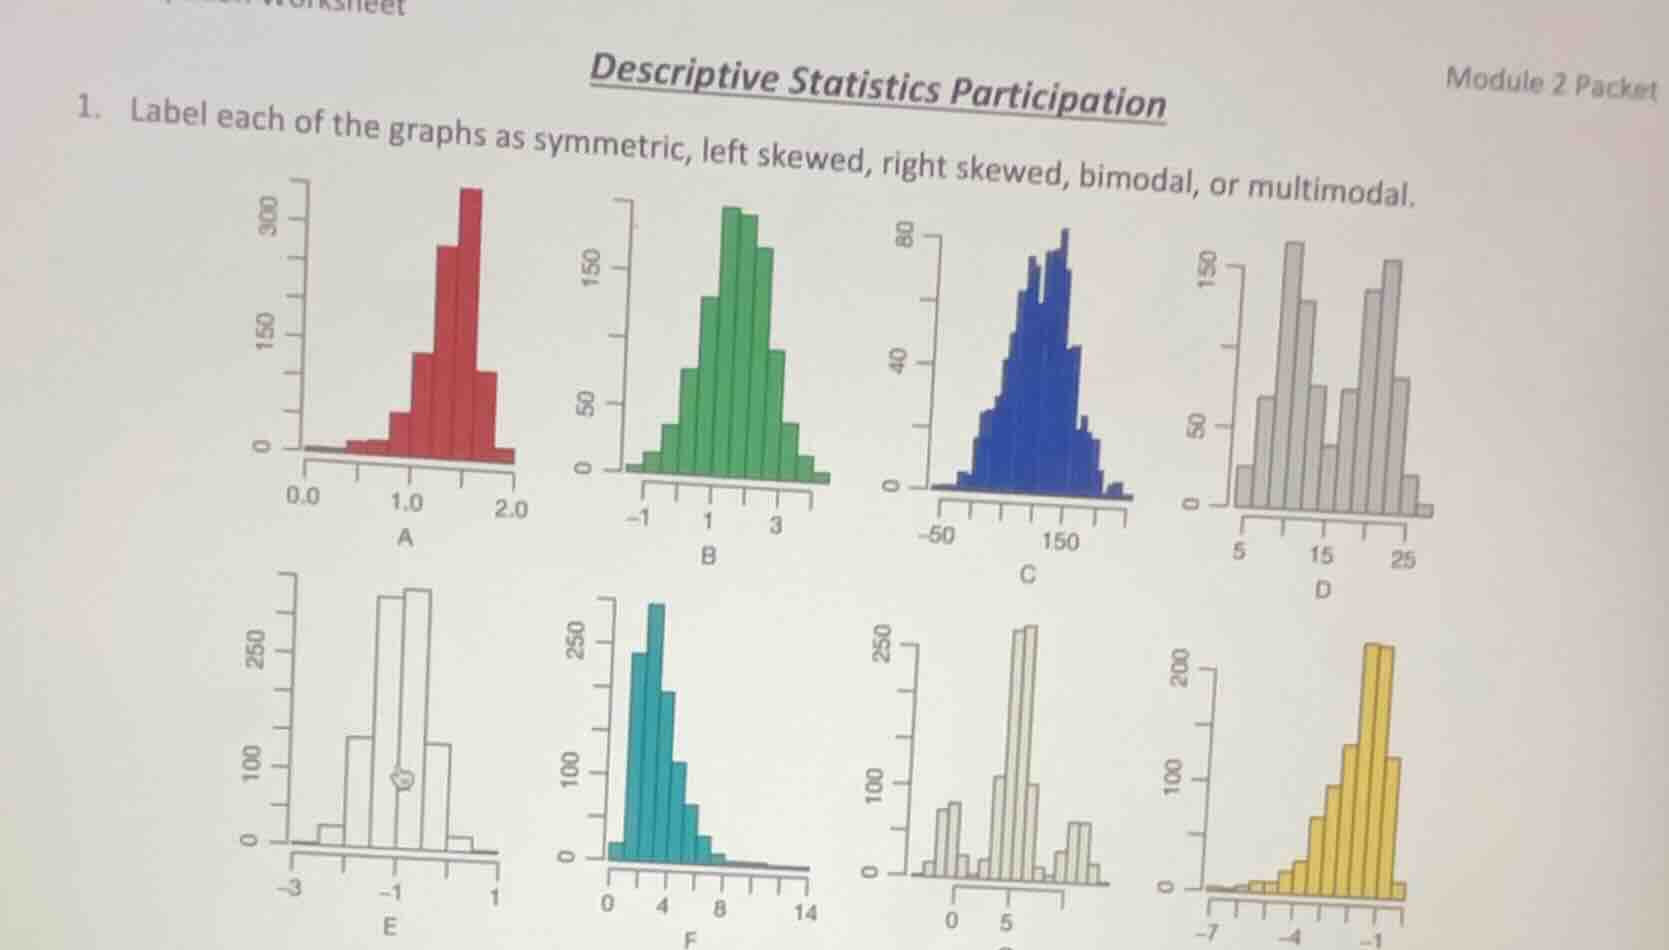
descriptive statistics participation module 2 packet 1. label each of the graphs as symmetric, left skewed, right skewed, bimodal, or multimodal.
Response
To solve this, we analyze each graph based on the definitions of symmetric, skewed, bimodal, or multimodal distributions:
Graph A (Red)
- The tail extends to the left (lower values), and the peak is on the right. This is a right - skewed distribution (also called positively skewed), as the tail is on the right side of the peak.
Graph B (Green)
- The distribution is symmetric around the center (the left and right sides of the peak mirror each other). So, Graph B is symmetric.
Graph C (Blue)
- The tail extends to the left (towards negative values), and the peak is on the right. Thus, Graph C is right - skewed (positively skewed).
Graph D (Gray)
- There are two distinct peaks (modes) in the distribution. So, Graph D is bimodal.
Graph E (Light Gray)
- There are two distinct peaks (modes) around the center. Hence, Graph E is bimodal.
Graph F (Cyan)
- The tail extends to the right (higher values), and the peak is on the left. This is a left - skewed (negatively skewed) distribution.
Graph G (Beige)
- There are three or more distinct peaks (modes) in the distribution. So, Graph G is multimodal.
Graph H (Yellow)
- The tail extends to the left (towards negative values), and the peak is on the right. Thus, Graph H is right - skewed (positively skewed).
Final Labels:
- A: Right Skewed
- B: Symmetric
- C: Right Skewed
- D: Bimodal
- E: Bimodal
- F: Left Skewed
- G: Multimodal
- H: Right Skewed

Snap & solve any problem in the app
Get step-by-step solutions on Sovi AI
Photo-based solutions with guided steps
Explore more problems and detailed explanations
To solve this, we analyze each graph based on the definitions of symmetric, skewed, bimodal, or multimodal distributions:
Graph A (Red)
- The tail extends to the left (lower values), and the peak is on the right. This is a right - skewed distribution (also called positively skewed), as the tail is on the right side of the peak.
Graph B (Green)
- The distribution is symmetric around the center (the left and right sides of the peak mirror each other). So, Graph B is symmetric.
Graph C (Blue)
- The tail extends to the left (towards negative values), and the peak is on the right. Thus, Graph C is right - skewed (positively skewed).
Graph D (Gray)
- There are two distinct peaks (modes) in the distribution. So, Graph D is bimodal.
Graph E (Light Gray)
- There are two distinct peaks (modes) around the center. Hence, Graph E is bimodal.
Graph F (Cyan)
- The tail extends to the right (higher values), and the peak is on the left. This is a left - skewed (negatively skewed) distribution.
Graph G (Beige)
- There are three or more distinct peaks (modes) in the distribution. So, Graph G is multimodal.
Graph H (Yellow)
- The tail extends to the left (towards negative values), and the peak is on the right. Thus, Graph H is right - skewed (positively skewed).
Final Labels:
- A: Right Skewed
- B: Symmetric
- C: Right Skewed
- D: Bimodal
- E: Bimodal
- F: Left Skewed
- G: Multimodal
- H: Right Skewed