QUESTION IMAGE
Question
descriptive statistics
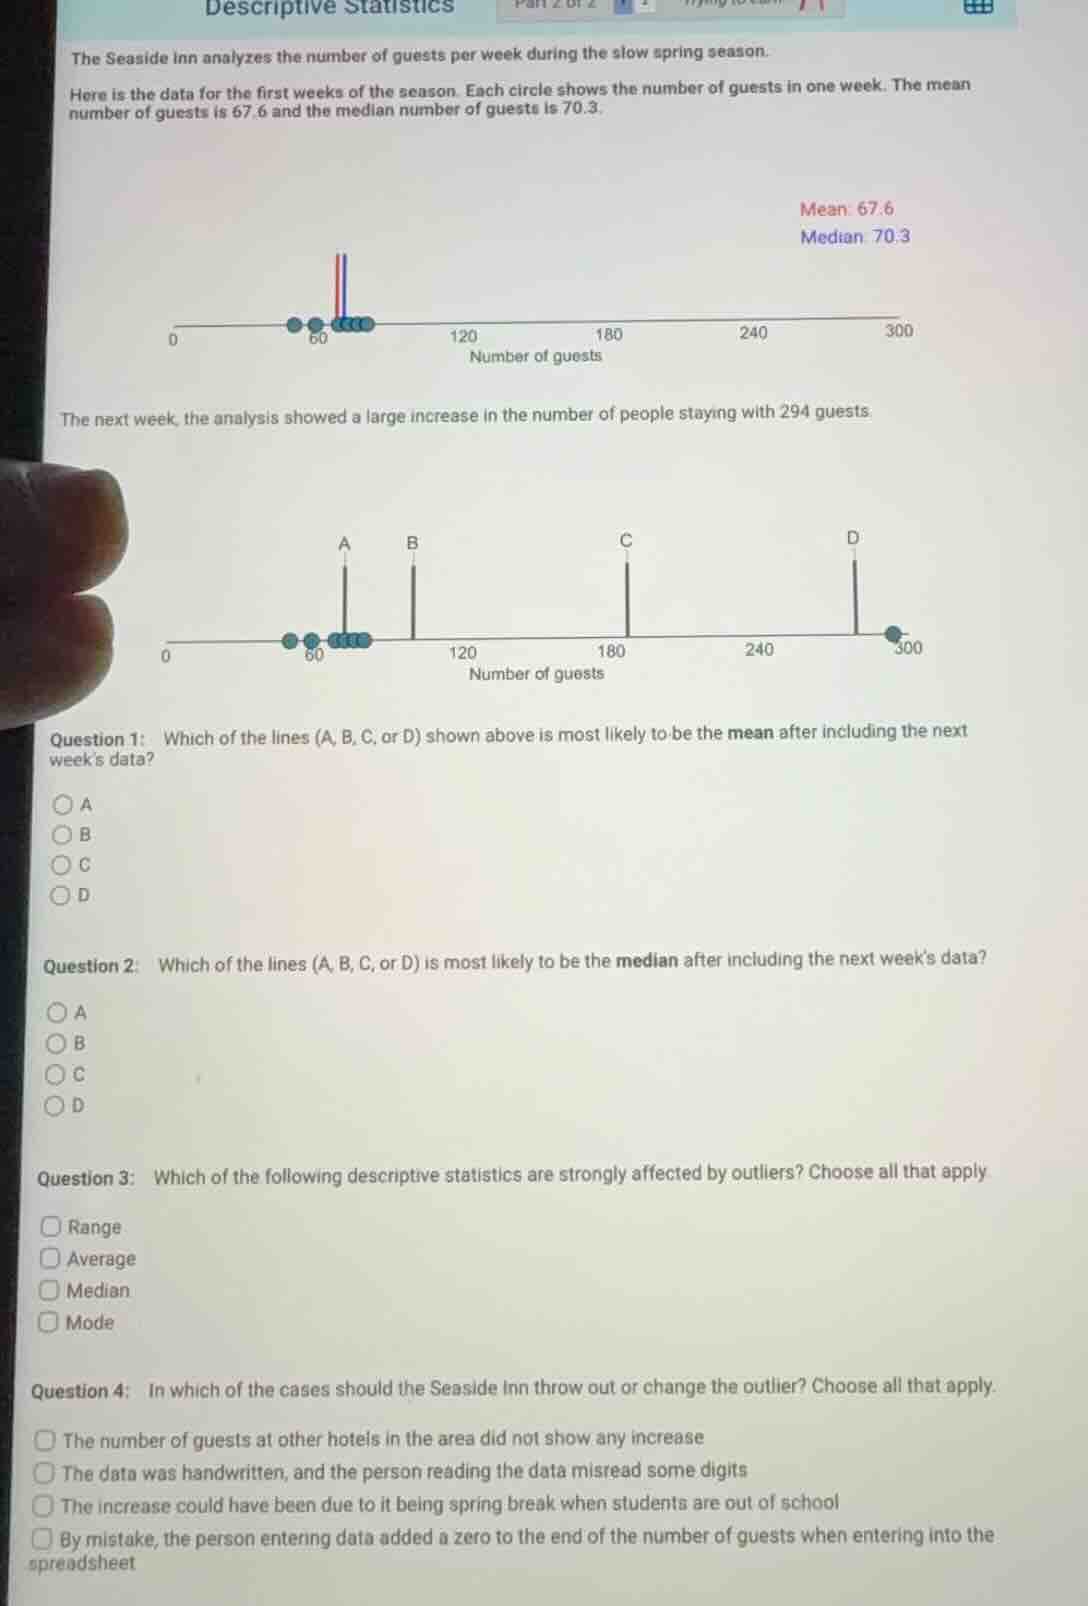
the seaside inn analyzes the number of guests per week during the slow spring season.
here is the data for the first weeks of the season. each circle shows the number of guests in one week. the mean number of guests is 67.6 and the median number of guests is 70.3.
mean: 67.6
median: 70.3
number line with circles near 60, labeled number of guests from 0 to 300
the next week, the analysis showed a large increase in the number of people staying with 294 guests.
number line with lines a, b, c, d at different positions, circles near 60, and a dot at 300, labeled number of guests from 0 to 300
question 1: which of the lines (a, b, c, or d) shown above is most likely to be the mean after including the next week’s data?
options: a, b, c, d
question 2: which of the lines (a, b, c, or d) is most likely to be the median after including the next week’s data?
options: a, b, c, d
question 3: which of the following descriptive statistics are strongly affected by outliers? choose all that apply
options: range, average, median, mode
question 4: in which of the cases should the seaside inn throw out or change the outlier? choose all that apply
options: the number of guests at other hotels in the area did not show any increase; the data was handwritten, and the person reading the data misread some digits; the increase could have been due to it being spring break when students are out of school; by mistake, the person entering data added a zero to the end of the number of guests when entering into the spreadsheet
Step1: Calculate new mean
First, count initial data points: 6 points (from the first dot plot). Original mean: $\bar{x}_1 = 67.6$, so total guests initially: $6 \times 67.6 = 405.6$. Add new guest count 294: total guests = $405.6 + 294 = 699.6$. New number of data points: $6+1=7$. New mean: $\frac{699.6}{7} \approx 99.94$.
Step2: Identify new median
Original data has 6 points, median is average of 3rd and 4th values (70.3). Adding one high value (294), new dataset has 7 points. Median is the 4th value, which is the same as the upper of the original two middle values, close to the original median (~70.3).
Step3: Analyze outlier impact
Range = max - min; an outlier increases max drastically. Mean (average) uses all values, so outliers pull it. Median is middle value, mode is most frequent, both are robust to outliers.
Step4: Evaluate outlier removal cases
Outliers are only removed if data is erroneous. Misread digits or data entry errors are valid reasons. External context (other hotels, spring break) are real events, not errors.

Snap & solve any problem in the app
Get step-by-step solutions on Sovi AI
Photo-based solutions with guided steps
Explore more problems and detailed explanations
Question 1: B
Question 2: A
Question 3: Range, Average
Question 4: The data was handwritten, and the person reading the data misread some digits; By mistake, the person entering data added a zero to the end of the number of guests when entering into the spreadsheet