QUESTION IMAGE
Question
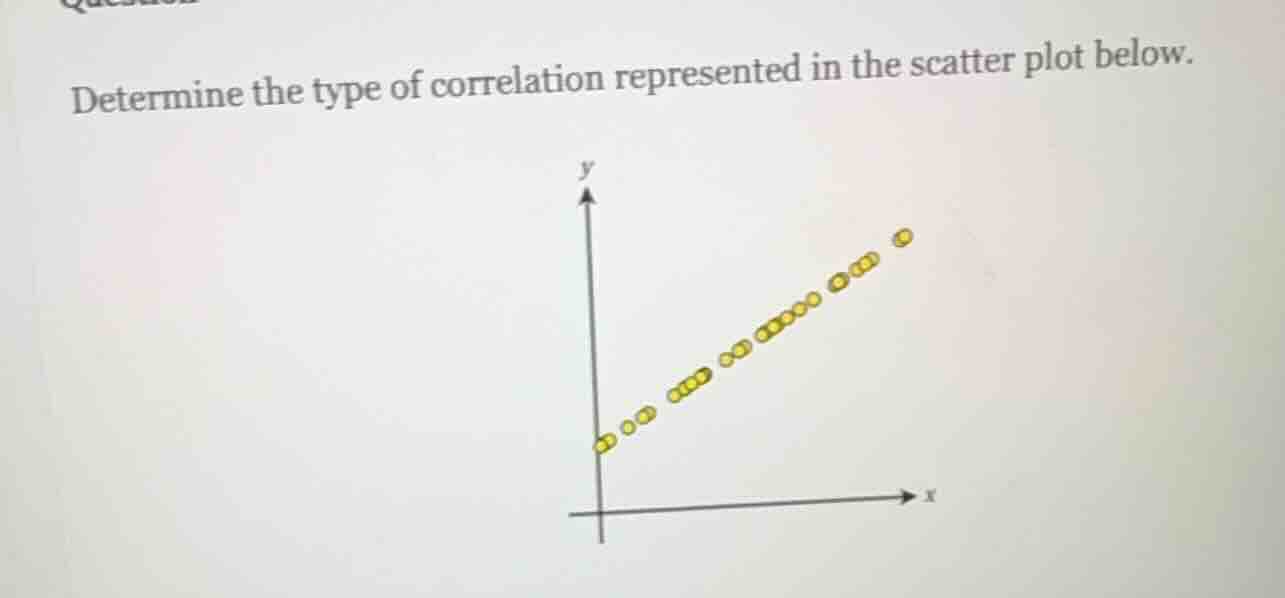
determine the type of correlation represented in the scatter plot below.
Brief Explanations
The scatter plot shows that as the value of the x-variable increases, the value of the y-variable increases consistently, with points clustered closely along an upward-sloping trend. This pattern indicates a strong positive linear relationship between the two variables.

Snap & solve any problem in the app
Get step-by-step solutions on Sovi AI
Photo-based solutions with guided steps
Explore more problems and detailed explanations
Strong positive correlation