QUESTION IMAGE
Question
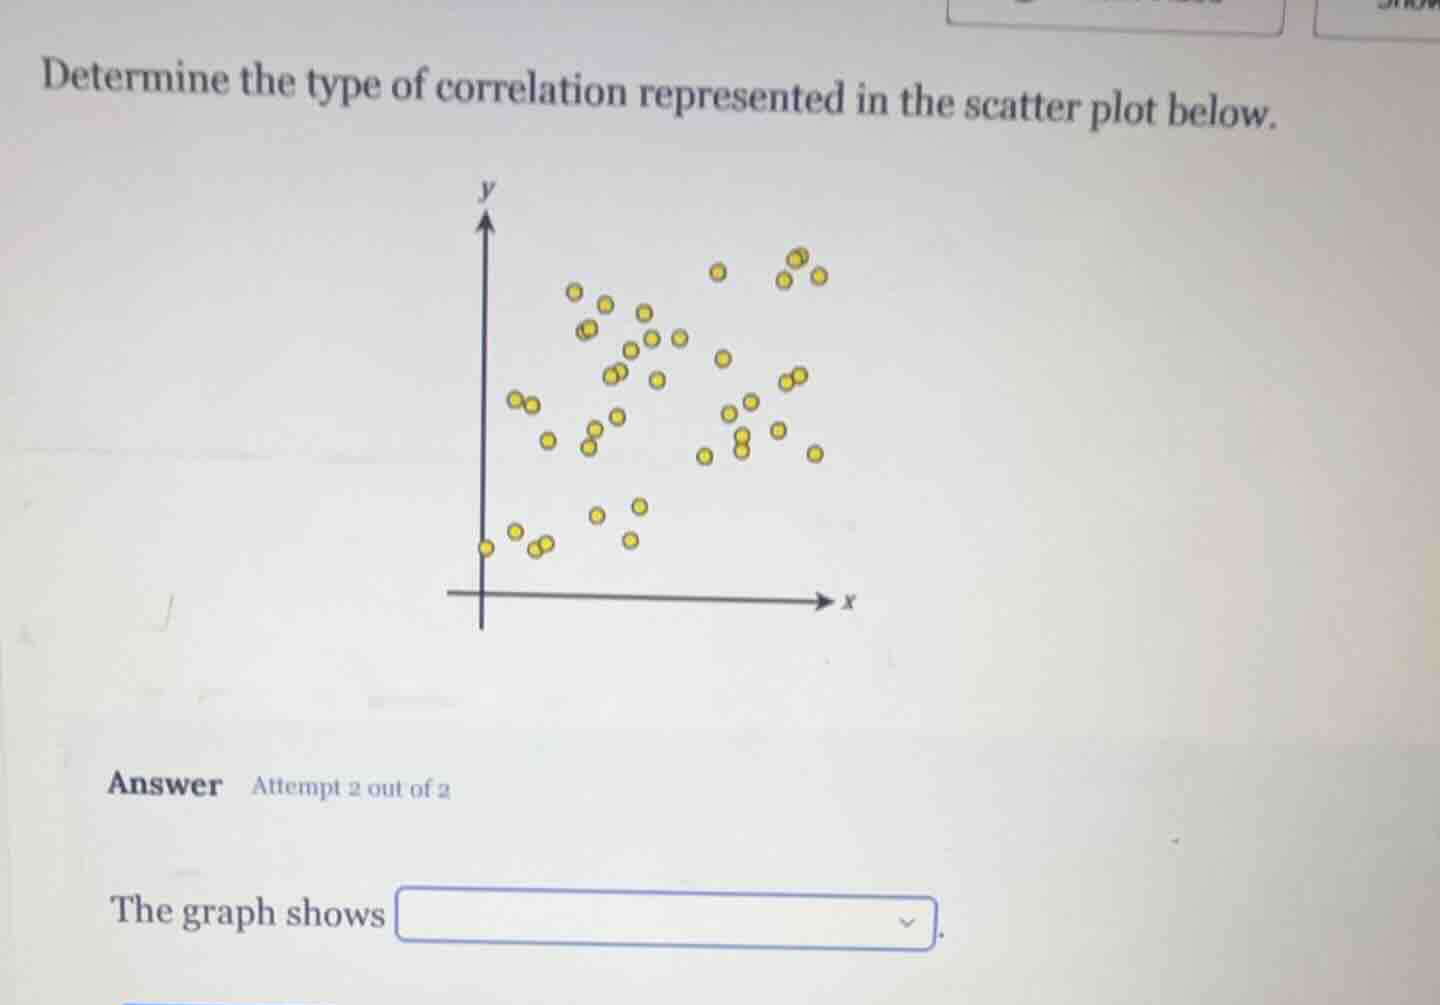
determine the type of correlation represented in the scatter plot below.
answer attempt 2 out of 2
the graph shows
Brief Explanations
The scatter plot shows that as the value of the x-variable increases, the value of the y-variable generally increases, with data points trending upward from left to right, indicating a positive relationship.

Snap & solve any problem in the app
Get step-by-step solutions on Sovi AI
Photo-based solutions with guided steps
Explore more problems and detailed explanations
a positive correlation