QUESTION IMAGE
Question
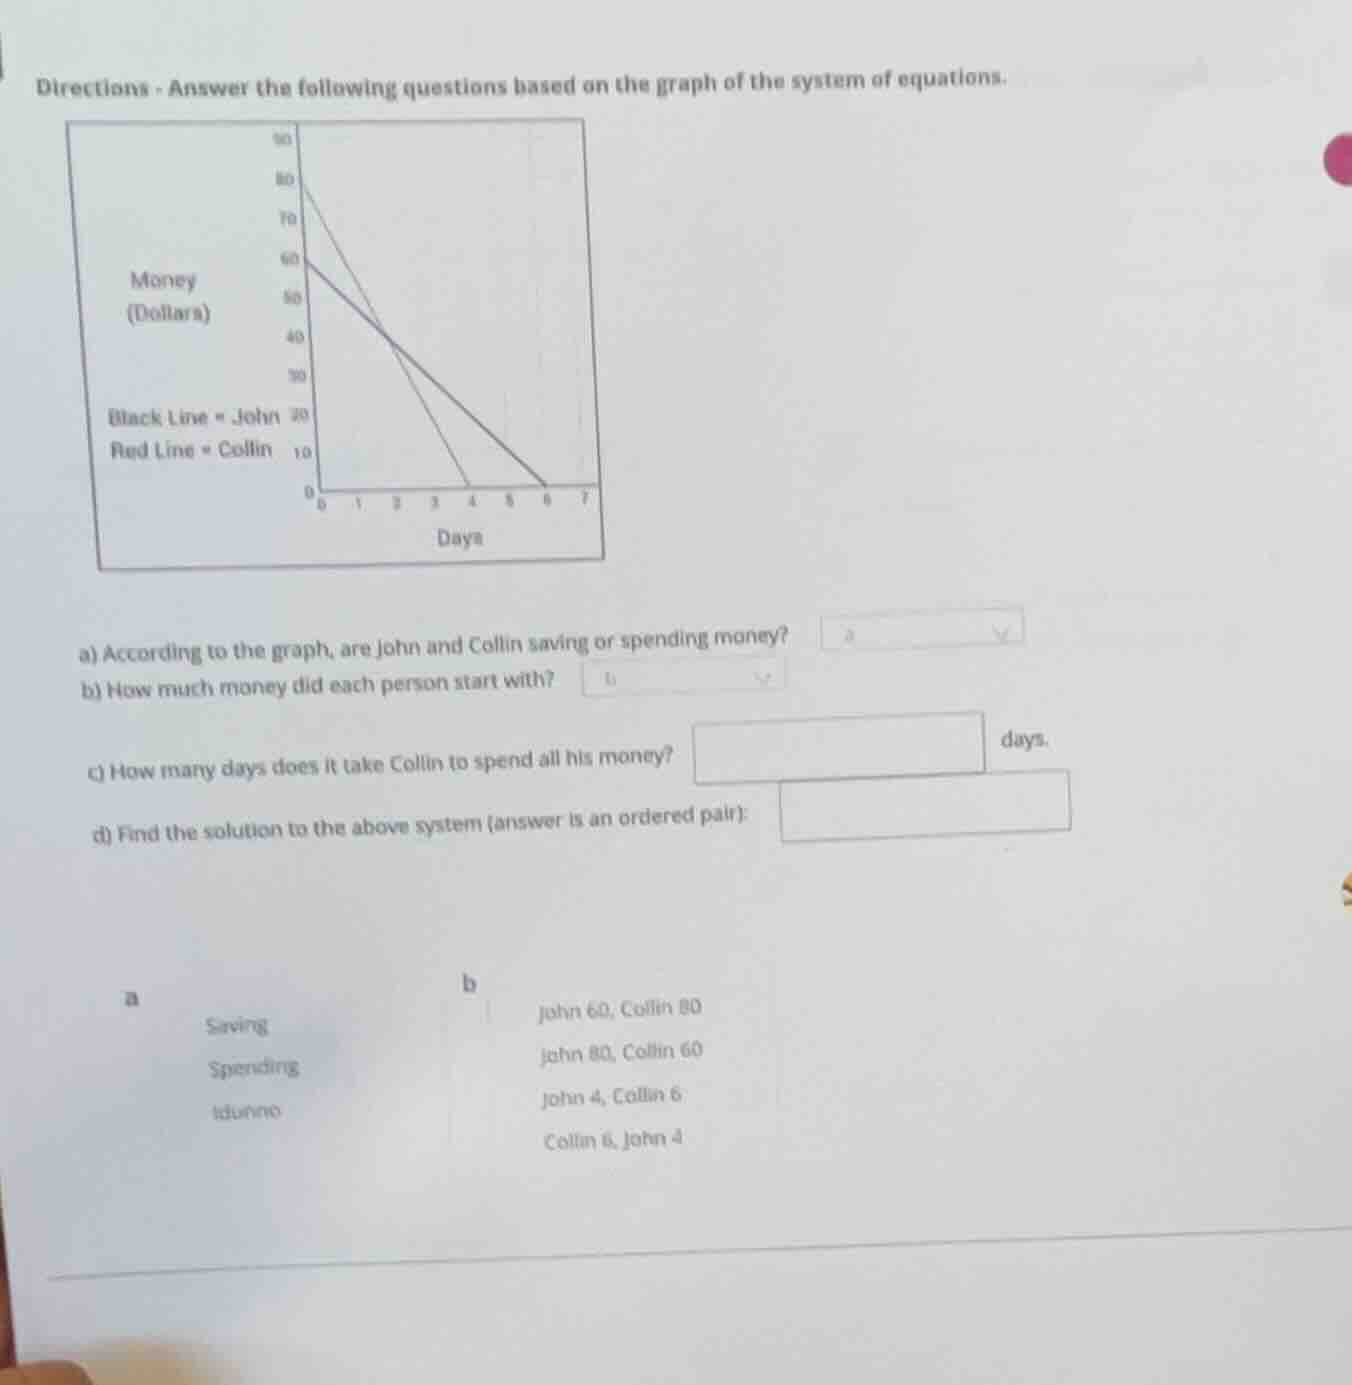
directions - answer the following questions based on the graph of the system of equations.
money
(dollars)
black line = john
red line = collin
days
a) according to the graph, are john and collin saving or spending money?
b) how much money did each person start with?
c) how many days does it take collin to spend all his money?
days.
d) find the solution to the above system (answer is an ordered pair):
a
saving
spending
idunno
b
john 60, collin 80
john 80, collin 60
john 4, collin 6
collin 6, john 4
Part a)
The graph shows the money (y - axis) decreasing as days (x - axis) increase. When money decreases over time, it means they are spending money (not saving, as saving would increase money over time or keep it stable in a non - decreasing way).
To find the starting money, we look at the y - intercept (when days = 0). For John (black line), at x = 0, the y - value is 60. For Collin (red line), at x = 0, the y - value is 80. So John starts with 60 dollars and Collin starts with 80 dollars.
Step 1: Identify Collin's line
Collin's line is the red line. We need to find when the money (y - value) reaches 0 (spends all money).
Step 2: Find the x - value when y = 0 for Collin's line
Looking at the graph, the red line (Collin) intersects the x - axis (y = 0) at x = 4. So it takes Collin 4 days to spend all his money.

Snap & solve any problem in the app
Get step-by-step solutions on Sovi AI
Photo-based solutions with guided steps
Explore more problems and detailed explanations
Spending