QUESTION IMAGE
Question
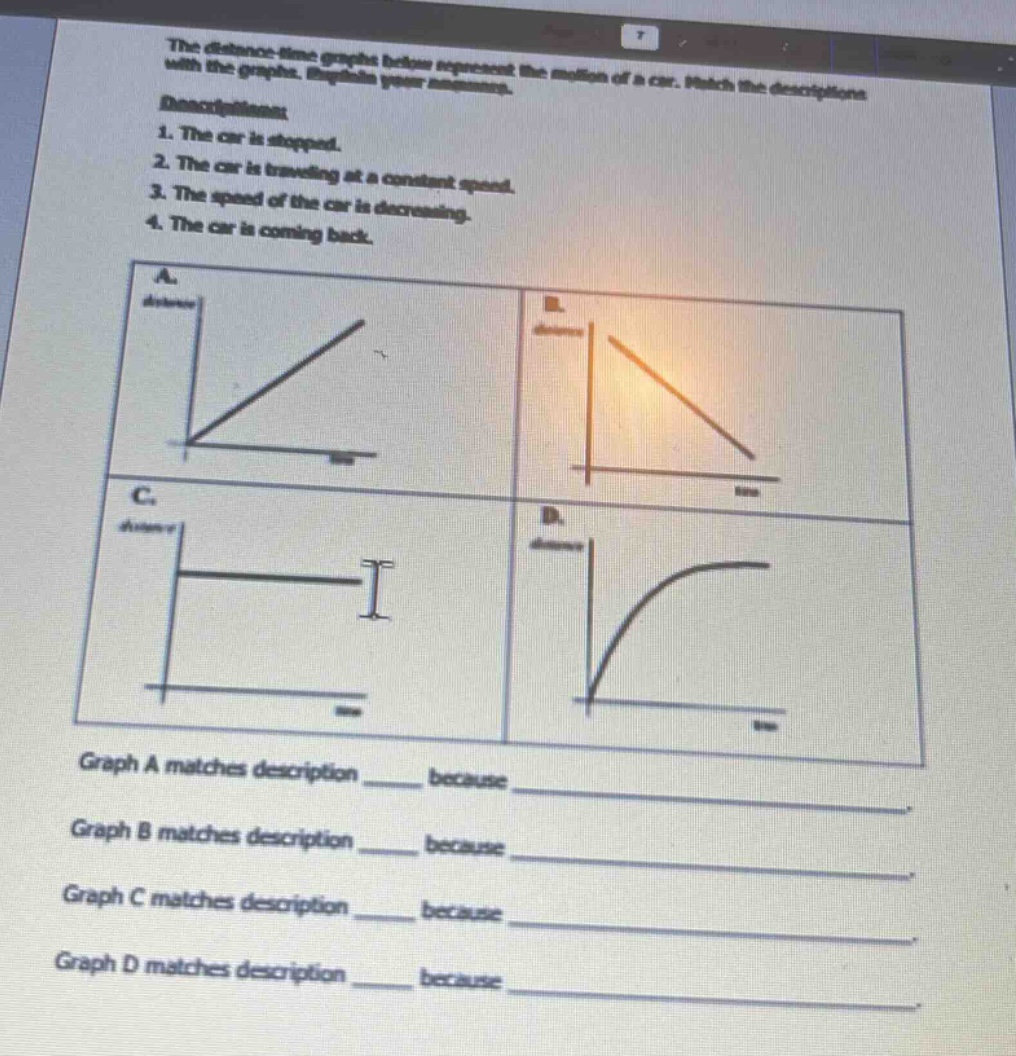
the distance - time graphs below represent the motion of a car. match the descriptions with the graphs. explain your reasoning.
descriptions:
- the car is stopped.
- the car is traveling at a constant speed.
- the speed of the car is decreasing.
- the car is coming back.
graph a matches description __ because ____________.
graph b matches description __ because ____________.
graph c matches description __ because ____________.
graph d matches description __ because ____________.
Graph A:
Step1: Analyze Graph A's shape
Graph A is a straight line with a positive slope, meaning distance increases linearly with time.
Step2: Relate to descriptions
A constant speed means distance changes at a constant rate (linear graph with positive slope). So it matches description 2.
Step1: Analyze Graph B's shape
Graph B is a straight line with negative slope, so distance decreases as time increases.
Step2: Relate to descriptions
"Coming back" means distance from start decreases, so this matches description 4.
Step1: Analyze Graph C's shape
Graph C is a horizontal line, so distance doesn't change with time.
Step2: Relate to descriptions
If distance is constant, the car isn't moving (stopped), so it matches description 1.

Snap & solve any problem in the app
Get step-by-step solutions on Sovi AI
Photo-based solutions with guided steps
Explore more problems and detailed explanations
Graph A matches description 2 because it's a straight line with positive slope (distance increases at constant rate, so constant speed).