QUESTION IMAGE
Question
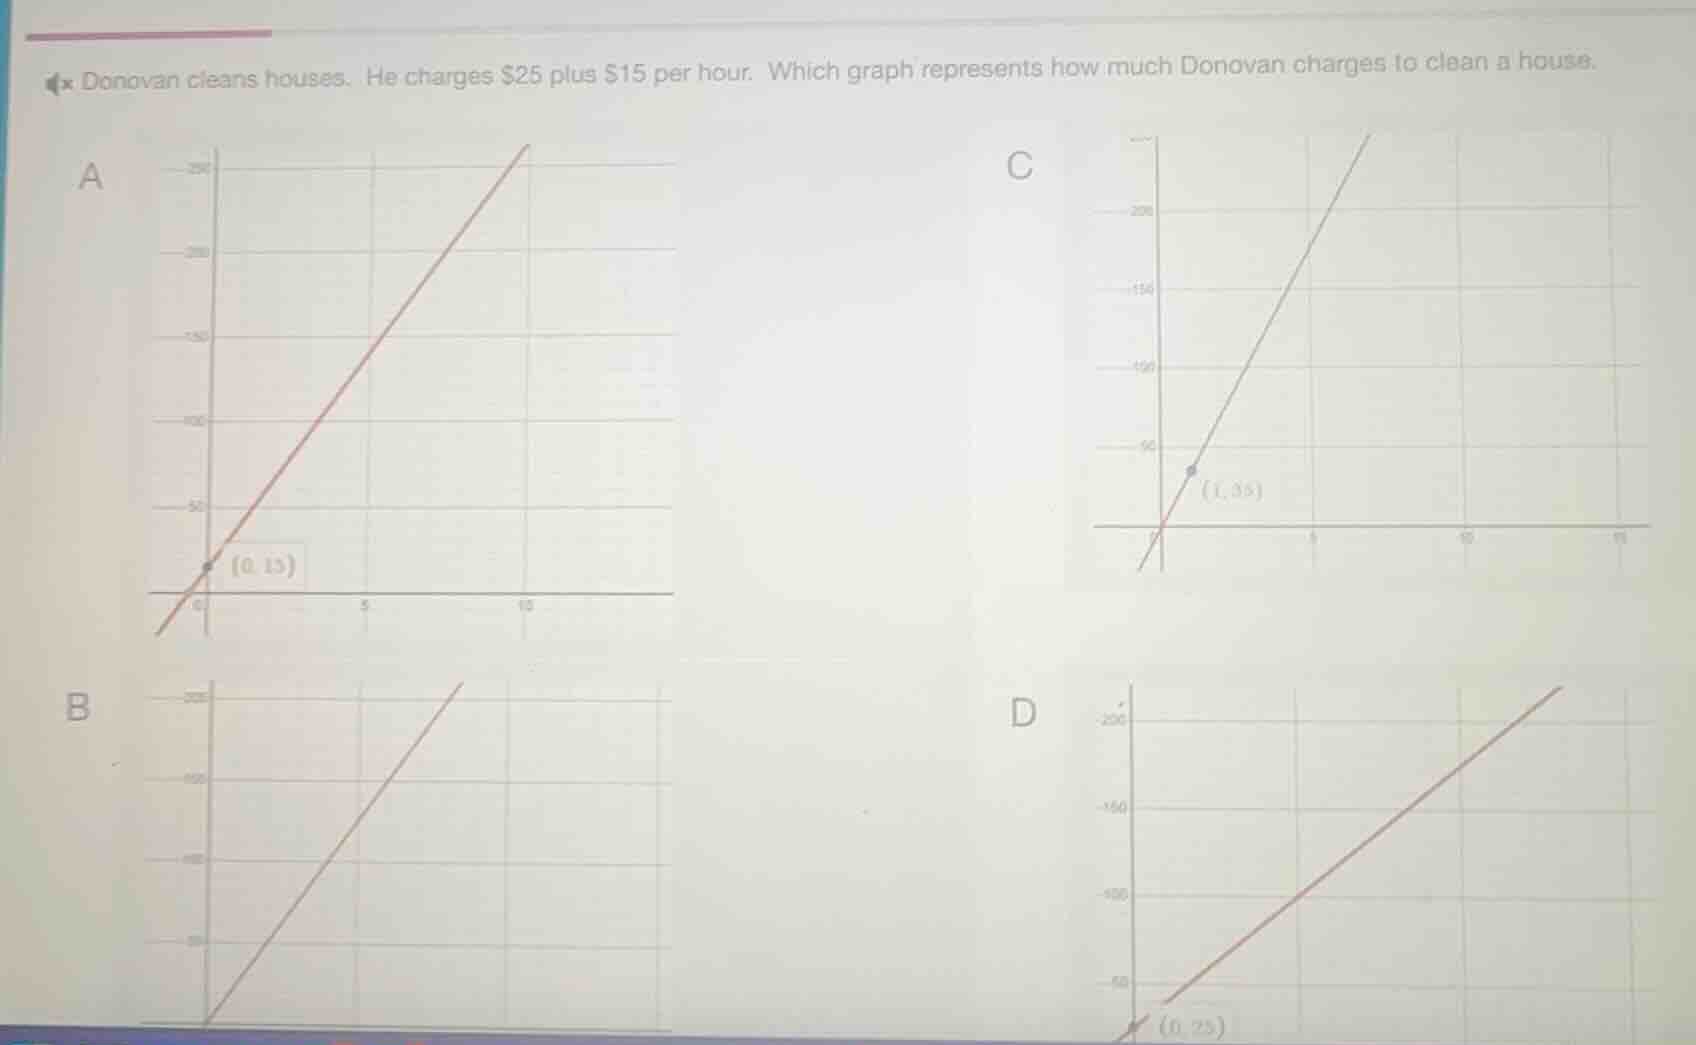
donovan cleans houses. he charges $25 plus $15 per hour. which graph represents how much donovan charges to clean a house.
Step1: Define the cost function
Let \( h \) be the number of hours and \( C \) be the total cost. The fixed charge is \$25, and the variable charge is \$15 per hour. So the cost function is \( C = 15h + 25 \).
Step2: Analyze the y-intercept
When \( h = 0 \) (no hours worked), the cost is the fixed charge. Substitute \( h = 0 \) into the cost function: \( C = 15(0) + 25 = 25 \). So the graph should have a y-intercept at \( (0, 25) \).
Step3: Analyze the slope and a point
The slope of the line is 15 (the rate per hour). Let's check a point. For \( h = 1 \), \( C = 15(1) + 25 = 40 \). Wait, but looking at the options, option D has a y-intercept at \( (0, 25) \), which matches our y-intercept calculation. Let's verify the other options:
- Option A: y-intercept at \( (0, 15) \), which is incorrect (should be 25).
- Option B: y-intercept at \( (0, 0) \), incorrect.
- Option C: y-intercept near 0 or a point \( (1, 35) \), but \( 15(1)+25 = 40 \), not 35.
- Option D: y-intercept at \( (0, 25) \), which matches our cost function's y-intercept. Then, for \( h = 1 \), \( C = 40 \), and as \( h \) increases, the line has a slope of 15, which is consistent with the cost function.

Snap & solve any problem in the app
Get step-by-step solutions on Sovi AI
Photo-based solutions with guided steps
Explore more problems and detailed explanations
D. The graph with y-intercept (0, 25) (the last graph labeled D)