QUESTION IMAGE
Question
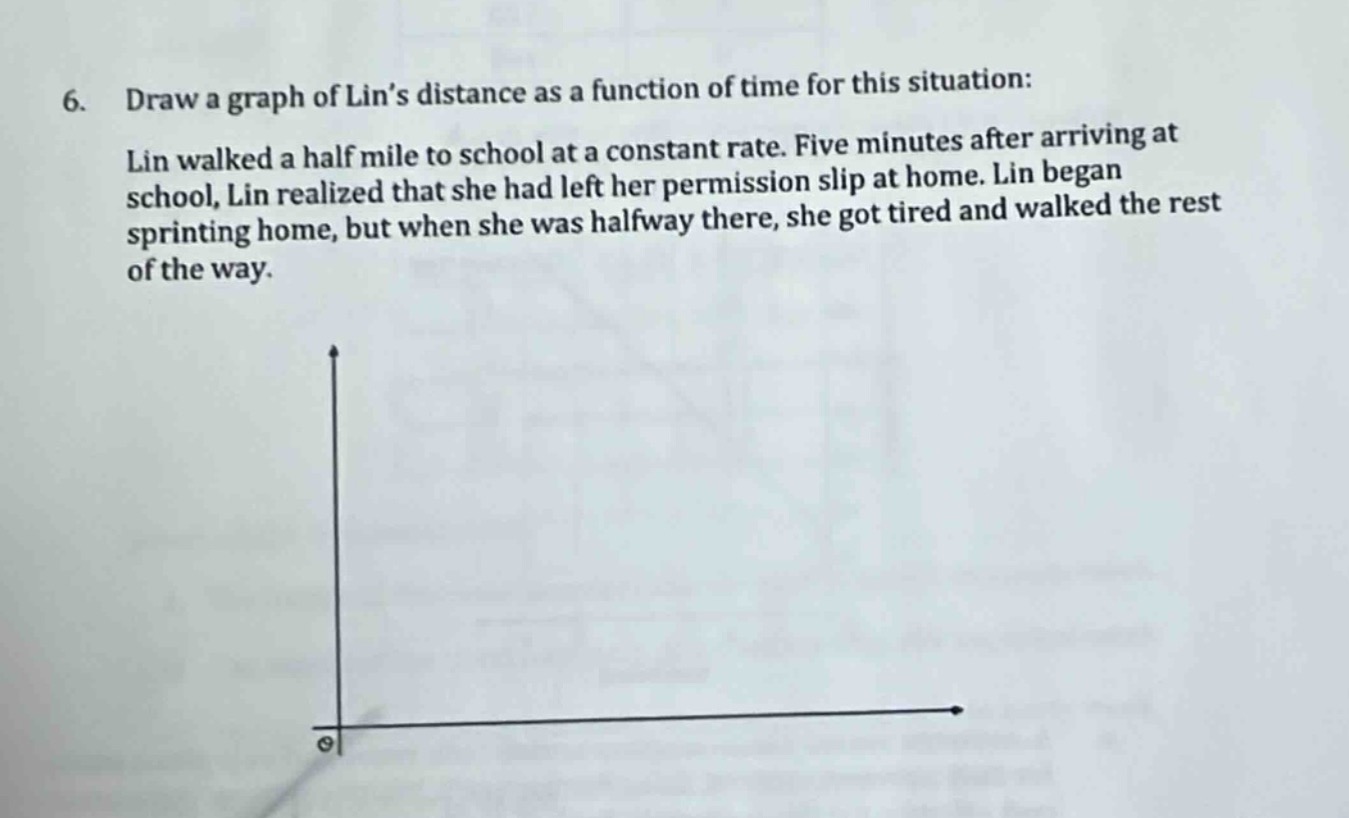
- draw a graph of lin’s distance as a function of time for this situation: lin walked a half mile to school at a constant rate. five minutes after arriving at school, lin realized that she had left her permission slip at home. lin began sprinting home, but when she was halfway there, she got tired and walked the rest of the way.
Step 1: Analyze the first segment (walking to school)
Lin walks a half - mile to school at a constant rate. Let's assume her walking rate is \(r_1\) (miles per minute). The time taken to walk to school, \(t_1=\frac{0.5}{r_1}\). During this time, her distance from home increases from 0 to 0.5 miles. So on the graph (with time on the x - axis and distance from home on the y - axis), this is a straight line with a positive slope (since distance is increasing with time) from \((0,0)\) to \((t_1, 0.5)\).
Step 2: Analyze the waiting time
Five minutes after arriving at school, she realizes she left the slip. So after reaching school at time \(t_1\), there is a 5 - minute interval where her distance from home remains 0.5 miles. So on the graph, this is a horizontal line from \((t_1, 0.5)\) to \((t_1 + 5,0.5)\).
Step 3: Analyze the sprinting home (first part of return)
She starts sprinting home. Let her sprinting rate be \(r_2\) (where \(r_2>r_1\) since she is sprinting). She sprints halfway home, which is a distance of \(\frac{0.5}{2}=0.25\) miles. The time taken to sprint this 0.25 miles, \(t_2=\frac{0.25}{r_2}\). During this time, her distance from home decreases from 0.5 to \(0.5 - 0.25 = 0.25\) miles. So on the graph, this is a straight line with a negative slope (steeper than the slope of the walking to school segment because \(r_2>r_1\)) from \((t_1 + 5,0.5)\) to \((t_1+5 + t_2,0.25)\).
Step 4: Analyze the walking home (second part of return)
After sprinting halfway, she walks the rest of the way home. The remaining distance is 0.25 miles, and she walks at rate \(r_1\). The time taken to walk this 0.25 miles, \(t_3=\frac{0.25}{r_1}\). During this time, her distance from home decreases from 0.25 to 0 miles. So on the graph, this is a straight line with a negative slope (equal to the slope of the walking to school segment) from \((t_1 + 5+t_2,0.25)\) to \((t_1 + 5+t_2+t_3,0)\).
To actually draw the graph:
- X - axis (Time): Label it as "Time (minutes)".
- Y - axis (Distance from home): Label it as "Distance (miles)".
- Plot the points as per the above analysis. The first segment is a line with positive slope from (0,0) to \((t_1,0.5)\), the second is a horizontal line from \((t_1,0.5)\) to \((t_1 + 5,0.5)\), the third is a line with a steeper negative slope from \((t_1 + 5,0.5)\) to \((t_1+5 + t_2,0.25)\), and the fourth is a line with the same negative slope as the first segment's positive slope from \((t_1 + 5+t_2,0.25)\) to \((t_1 + 5+t_2+t_3,0)\).

Snap & solve any problem in the app
Get step-by-step solutions on Sovi AI
Photo-based solutions with guided steps
Explore more problems and detailed explanations
The graph has four segments:
- A line with positive slope from \((0,0)\) to \((t_1,0.5)\) (walking to school).
- A horizontal line from \((t_1,0.5)\) to \((t_1 + 5,0.5)\) (waiting at school).
- A line with a steeper negative slope from \((t_1 + 5,0.5)\) to \((t_1+5 + t_2,0.25)\) (sprinting halfway home).
- A line with a negative slope (same as the first segment's positive slope) from \((t_1 + 5+t_2,0.25)\) to \((t_1 + 5+t_2+t_3,0)\) (walking the rest of the way home). The exact shape depends on the values of \(r_1\) and \(r_2\), but the general shape follows these four segments.