QUESTION IMAGE
Question
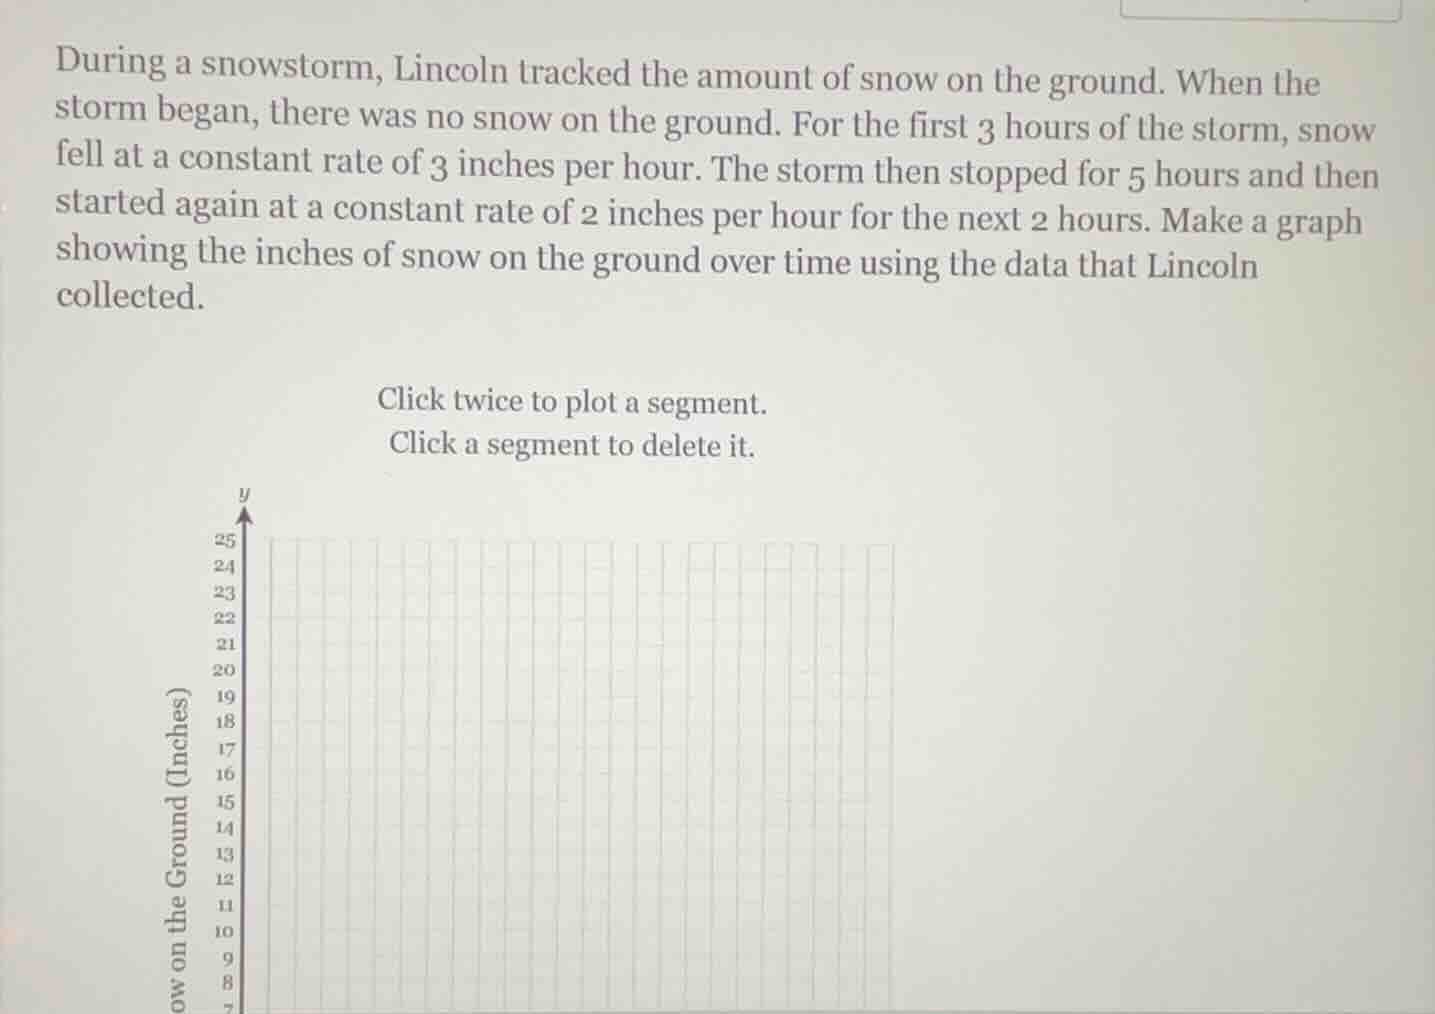
during a snowstorm, lincoln tracked the amount of snow on the ground. when the storm began, there was no snow on the ground. for the first 3 hours of the storm, snow fell at a constant rate of 3 inches per hour. the storm then stopped for 5 hours and then started again at a constant rate of 2 inches per hour for the next 2 hours. make a graph showing the inches of snow on the ground over time using the data that lincoln collected.
click twice to plot a segment.
click a segment to delete it.
Step1: Analyze the first phase
The storm begins with 0 snow. For the first 3 hours, snow falls at 3 inches per hour. So at \( t = 0 \), \( y = 0 \); at \( t = 3 \), \( y=3\times3 = 9 \). So we have the segment from \((0,0)\) to \((3,9)\).
Step2: Analyze the second phase
The storm stops for 5 hours. So from \( t = 3 \) to \( t=3 + 5=8 \), the amount of snow remains constant at 9 inches. So we have the segment from \((3,9)\) to \((8,9)\).
Step3: Analyze the third phase
Then the storm starts again at 2 inches per hour for 2 hours. At \( t = 8 \), \( y = 9 \); at \( t=8 + 2=10 \), \( y=9+2\times2=13 \). So we have the segment from \((8,9)\) to \((10,13)\).
To graph:
- Plot the points \((0,0)\), \((3,9)\), \((8,9)\), \((10,13)\).
- Draw a line segment between \((0,0)\) and \((3,9)\) (representing the first 3 hours of snowfall).
- Draw a horizontal line segment between \((3,9)\) and \((8,9)\) (representing the 5 - hour break with no snowfall).
- Draw a line segment between \((8,9)\) and \((10,13)\) (representing the last 2 hours of snowfall).

Snap & solve any problem in the app
Get step-by-step solutions on Sovi AI
Photo-based solutions with guided steps
Explore more problems and detailed explanations
The graph has three segments: from \((0,0)\) to \((3,9)\), from \((3,9)\) to \((8,9)\), and from \((8,9)\) to \((10,13)\).