QUESTION IMAGE
Question
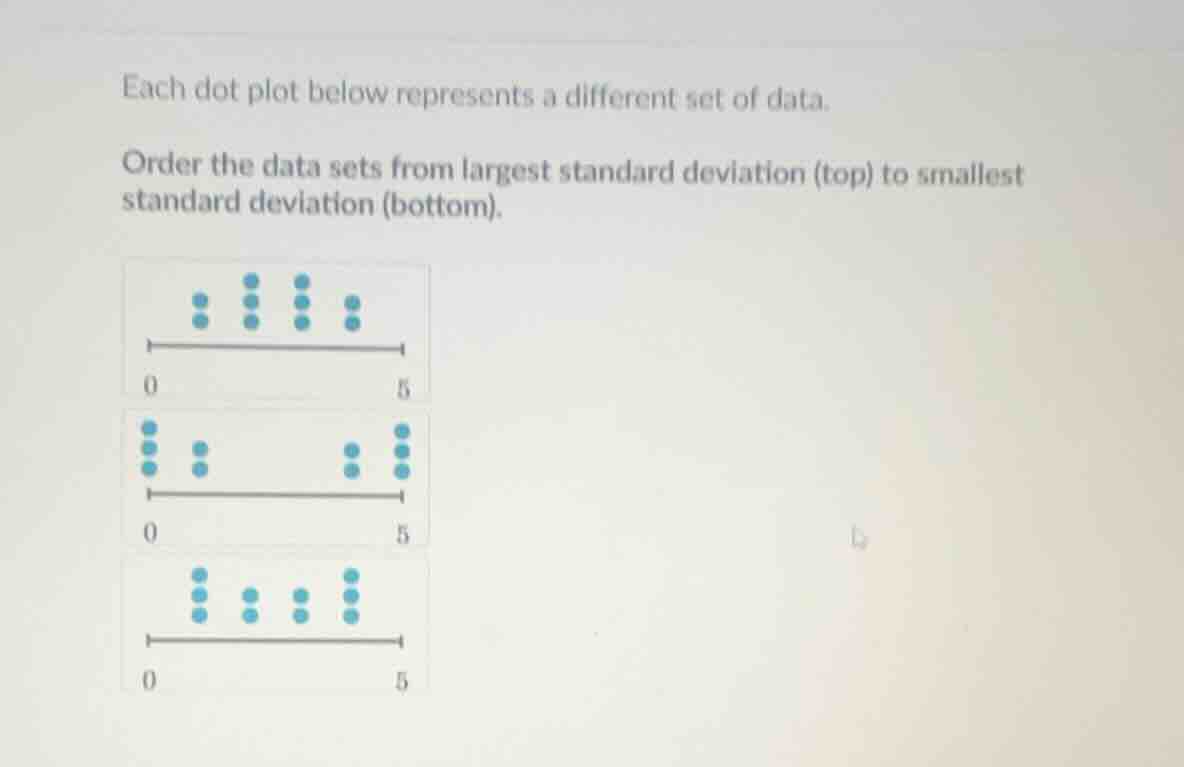
each dot plot below represents a different set of data. order the data sets from largest standard deviation (top) to smallest standard deviation (bottom).
Step1: Assess spread of each plot
Standard deviation measures data spread from the mean. The more spread out the data, the larger the standard deviation.
- Second plot: Data clusters at the far ends (0 and 5), with only a few points in the middle. This has the widest spread.
- Third plot: Data is spread across 1, 2, 3, 5, with less extreme clustering than the second plot.
- First plot: Data clusters near the middle (1, 2, 3, 4), so it has the narrowest spread.
Step2: Order by spread (largest to smallest)
Rank the plots from most spread (largest standard deviation) to least spread (smallest standard deviation).

Snap & solve any problem in the app
Get step-by-step solutions on Sovi AI
Photo-based solutions with guided steps
Explore more problems and detailed explanations
- The second dot plot (clustered at 0 and 5)
- The third dot plot (spread across 1, 2, 3, 5)
- The first dot plot (clustered near the middle)