QUESTION IMAGE
Question
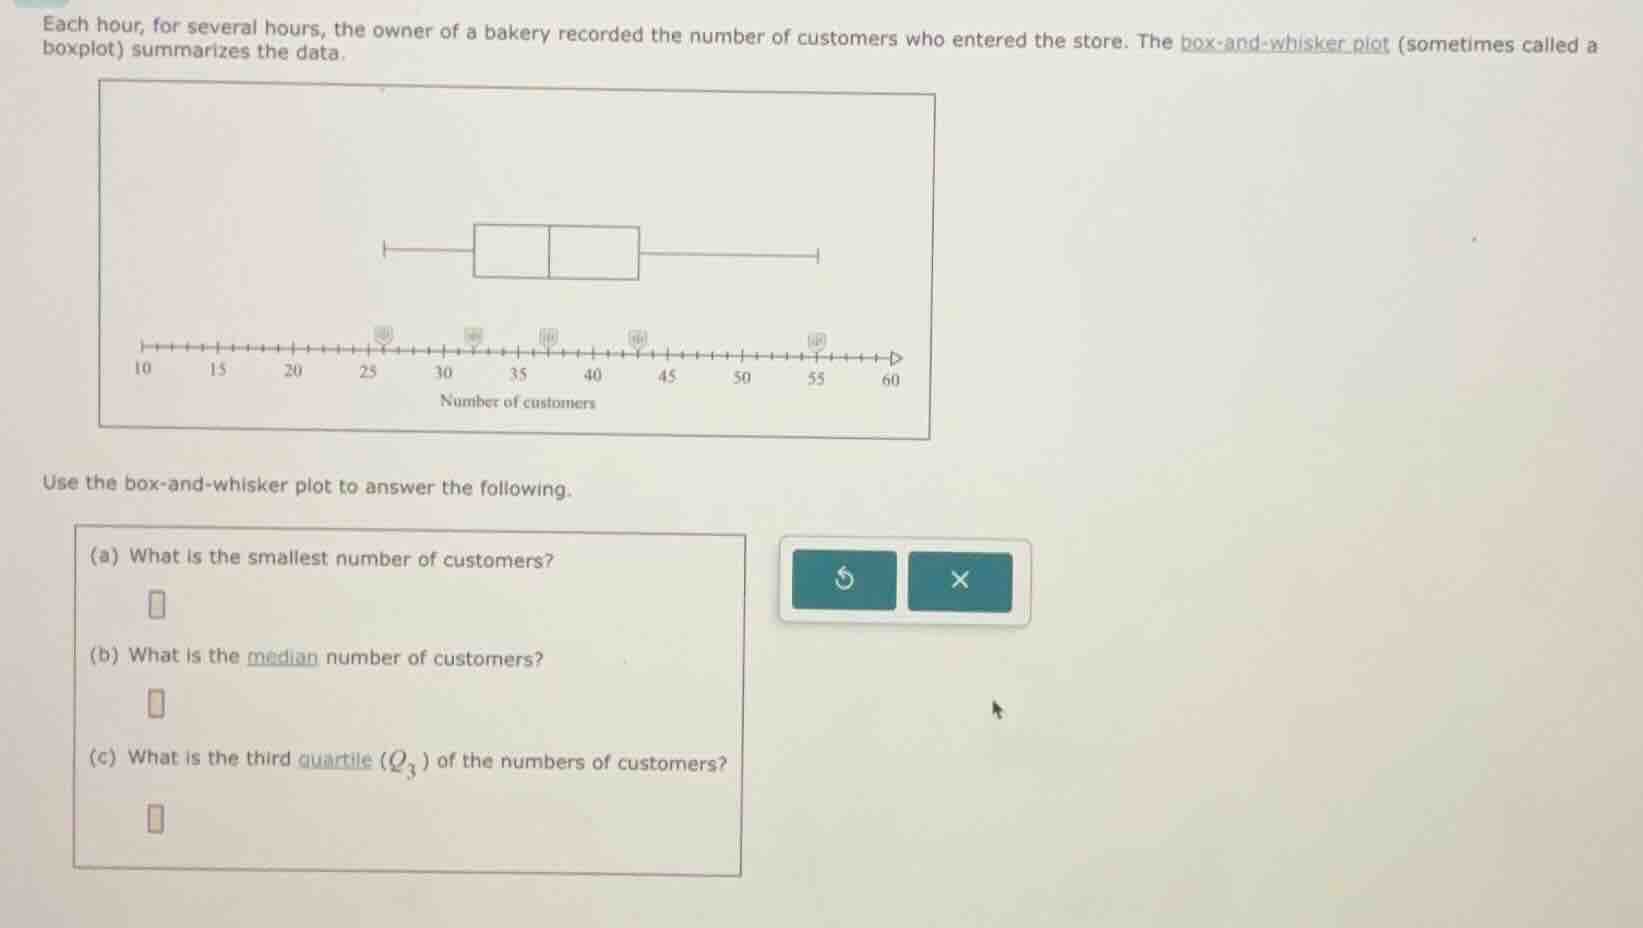
each hour, for several hours, the owner of a bakery recorded the number of customers who entered the store. the box-and-whisker plot (sometimes called a boxplot) summarizes the data.
box-and-whisker plot image with number of customers on the x - axis from 10 to 60
use the box - and - whisker plot to answer the following.
(a) what is the smallest number of customers?
(b) what is the median number of customers?
(c) what is the third quartile ($q_3$) of the numbers of customers?
Step1: Identify minimum value
The leftmost whisker of the boxplot corresponds to the smallest value, which aligns with 25 on the axis.
Step2: Identify median value
The line inside the box corresponds to the median, which aligns with 35 on the axis.
Step3: Identify third quartile
The right edge of the box corresponds to the third quartile ($Q_3$), which aligns with 40 on the axis.

Snap & solve any problem in the app
Get step-by-step solutions on Sovi AI
Photo-based solutions with guided steps
Explore more problems and detailed explanations
(a) 25
(b) 35
(c) 40