QUESTION IMAGE
Question
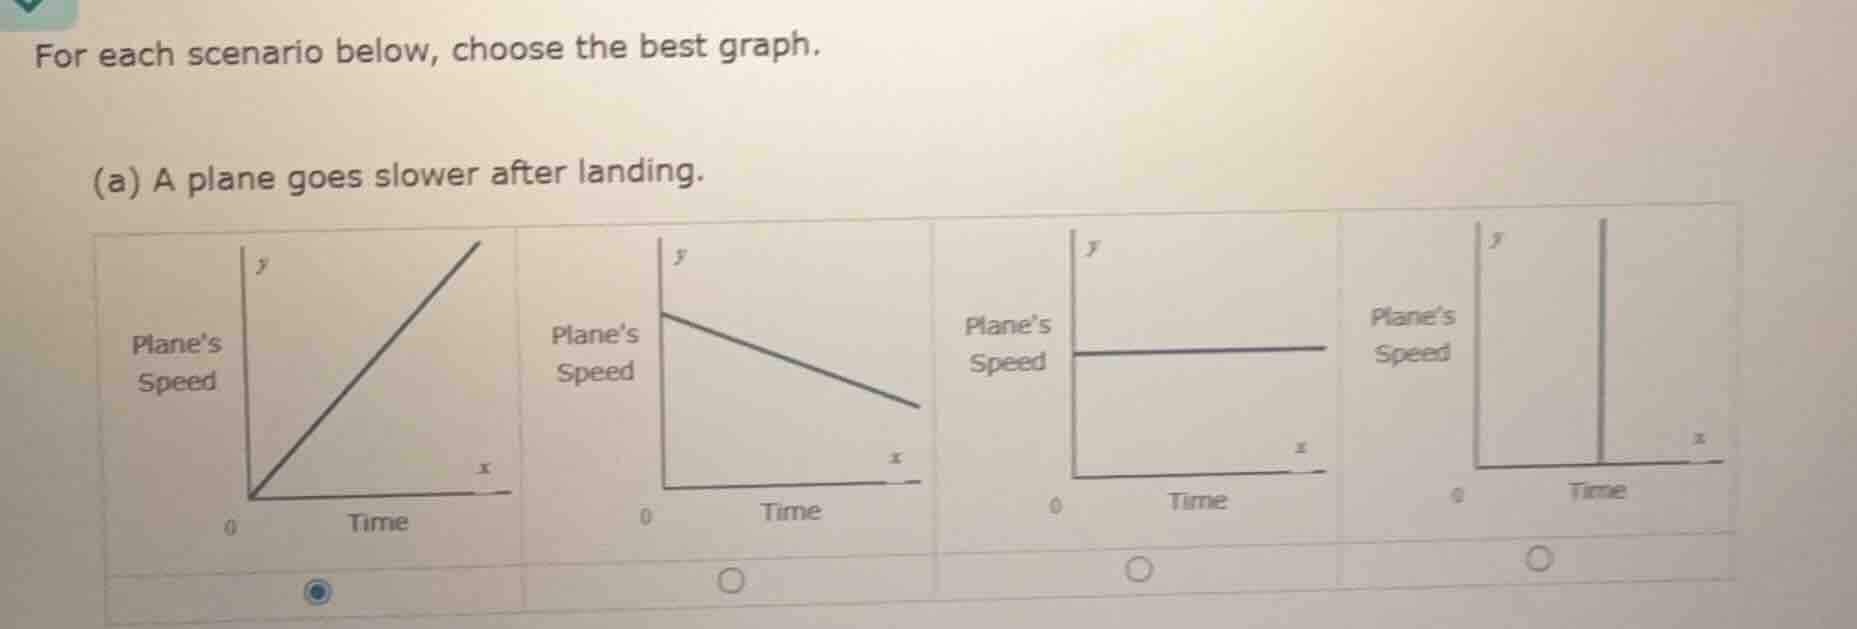
for each scenario below, choose the best graph. (a) a plane goes slower after landing. graphs are shown with planes speed on y - axis and time on x - axis: first graph is a line from (0,0) increasing, second is a line decreasing from a positive y - intercept, third is a horizontal line, fourth is a vertical line
Step1: Analyze the scenario
The scenario is about a plane's speed over time after landing. The plane slows down, so speed (y - axis) should decrease as time (x - axis) increases.
Step2: Evaluate each graph
- First graph: Speed increases with time (not matching, since plane slows down).
- Second graph: Speed decreases as time increases (matches the scenario of plane slowing down after landing).
- Third graph: Speed is constant (not matching, as plane is slowing down).
- Fourth graph: Unrealistic (vertical line, speed would be infinite at a time point, not matching).

Snap & solve any problem in the app
Get step-by-step solutions on Sovi AI
Photo-based solutions with guided steps
Explore more problems and detailed explanations
The second graph (the one with the line decreasing from left to right, labeled "Plane's Speed" on y - axis and "Time" on x - axis)