QUESTION IMAGE
Question
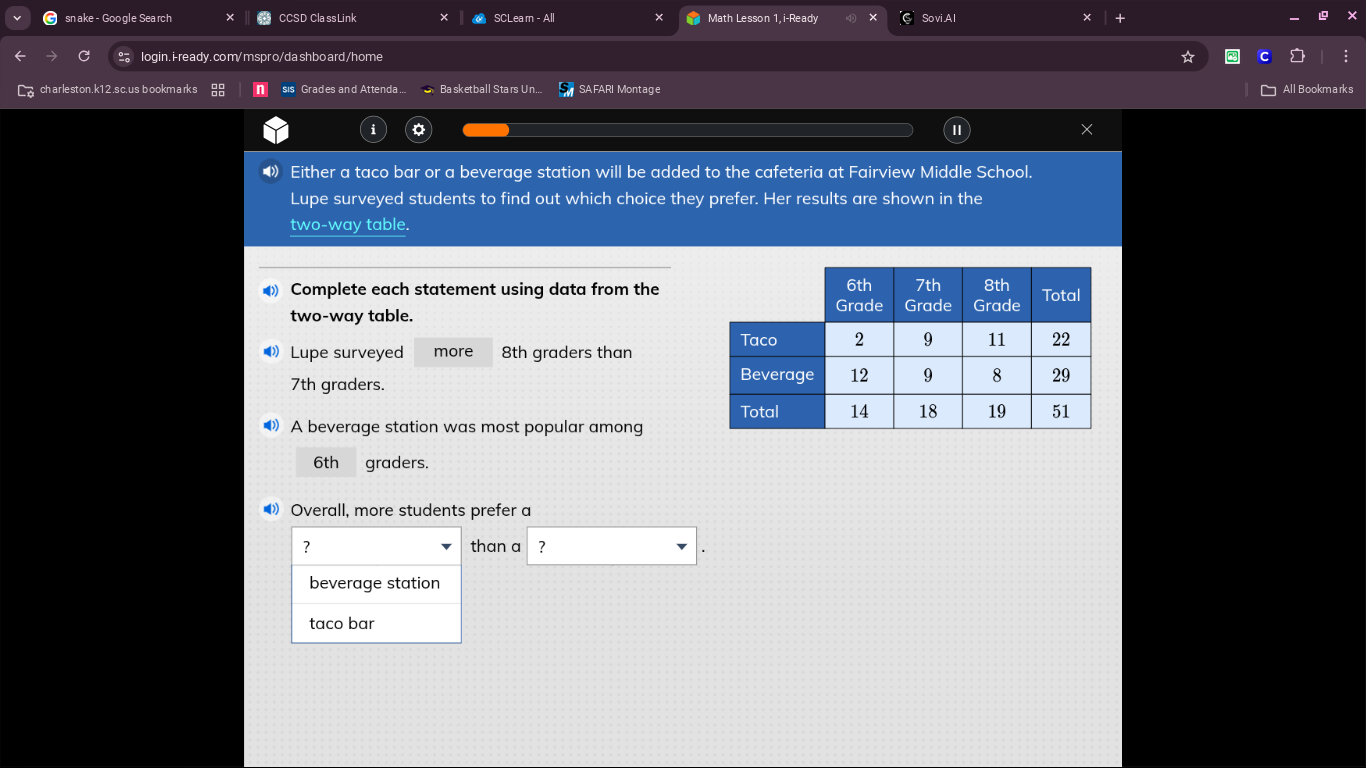
either a taco bar or a beverage station will be added to the cafeteria at fairview middle school.
lupe surveyed students to find out which choice they prefer. her results are shown in the two-way table.
complete each statement using data from the two-way table.
lupe surveyed more 8th graders than 7th graders.
a beverage station was most popular among 6th graders.
overall, more students prefer a ? than a ? .
beverage station
taco bar
Step1: Find 8th vs 7th grader count
Subtract 7th grade total from 8th grade total: $19 - 18 = 1$
Step2: Identify most popular grade for beverage
Compare beverage counts per grade: $12 > 9 > 8$
Step3: Compare overall preference totals
Compare total beverage vs taco counts: $29 > 22$

Snap & solve any problem in the app
Get step-by-step solutions on Sovi AI
Photo-based solutions with guided steps
Explore more problems and detailed explanations
- Lupe surveyed $\boldsymbol{1}$ more 8th graders than 7th graders.
- A beverage station was most popular among $\boldsymbol{6th}$ graders.
- Overall, more students prefer a $\boldsymbol{beverage station}$ than a $\boldsymbol{taco bar}$.