QUESTION IMAGE
Question
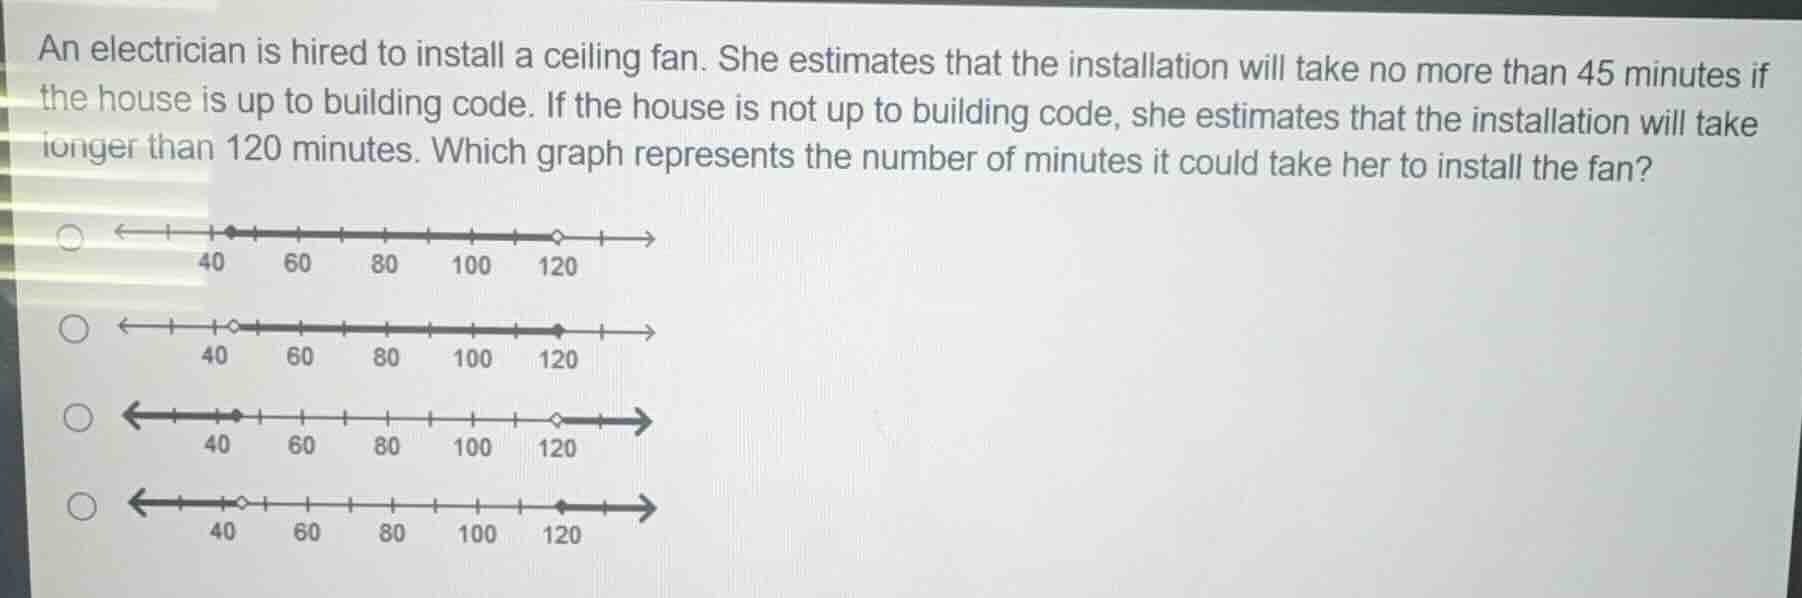
an electrician is hired to install a ceiling fan. she estimates that the installation will take no more than 45 minutes if the house is up to building code. if the house is not up to building code, she estimates that the installation will take longer than 120 minutes. which graph represents the number of minutes it could take her to install the fan?
Step1: Define time conditions
Let $t$ = installation time (minutes).
Condition 1: $t \leq 45$ (code-compliant house)
Condition 2: $t > 120$ (non-compliant house)
Step2: Match to number line rules
- For $t \leq 45$: Closed dot at 45, arrow left.
- For $t > 120$: Open dot at 120, arrow right.

Snap & solve any problem in the app
Get step-by-step solutions on Sovi AI
Photo-based solutions with guided steps
Explore more problems and detailed explanations
The fourth option (left arrow with closed dot at 45, right arrow with open dot at 120)