QUESTION IMAGE
Question
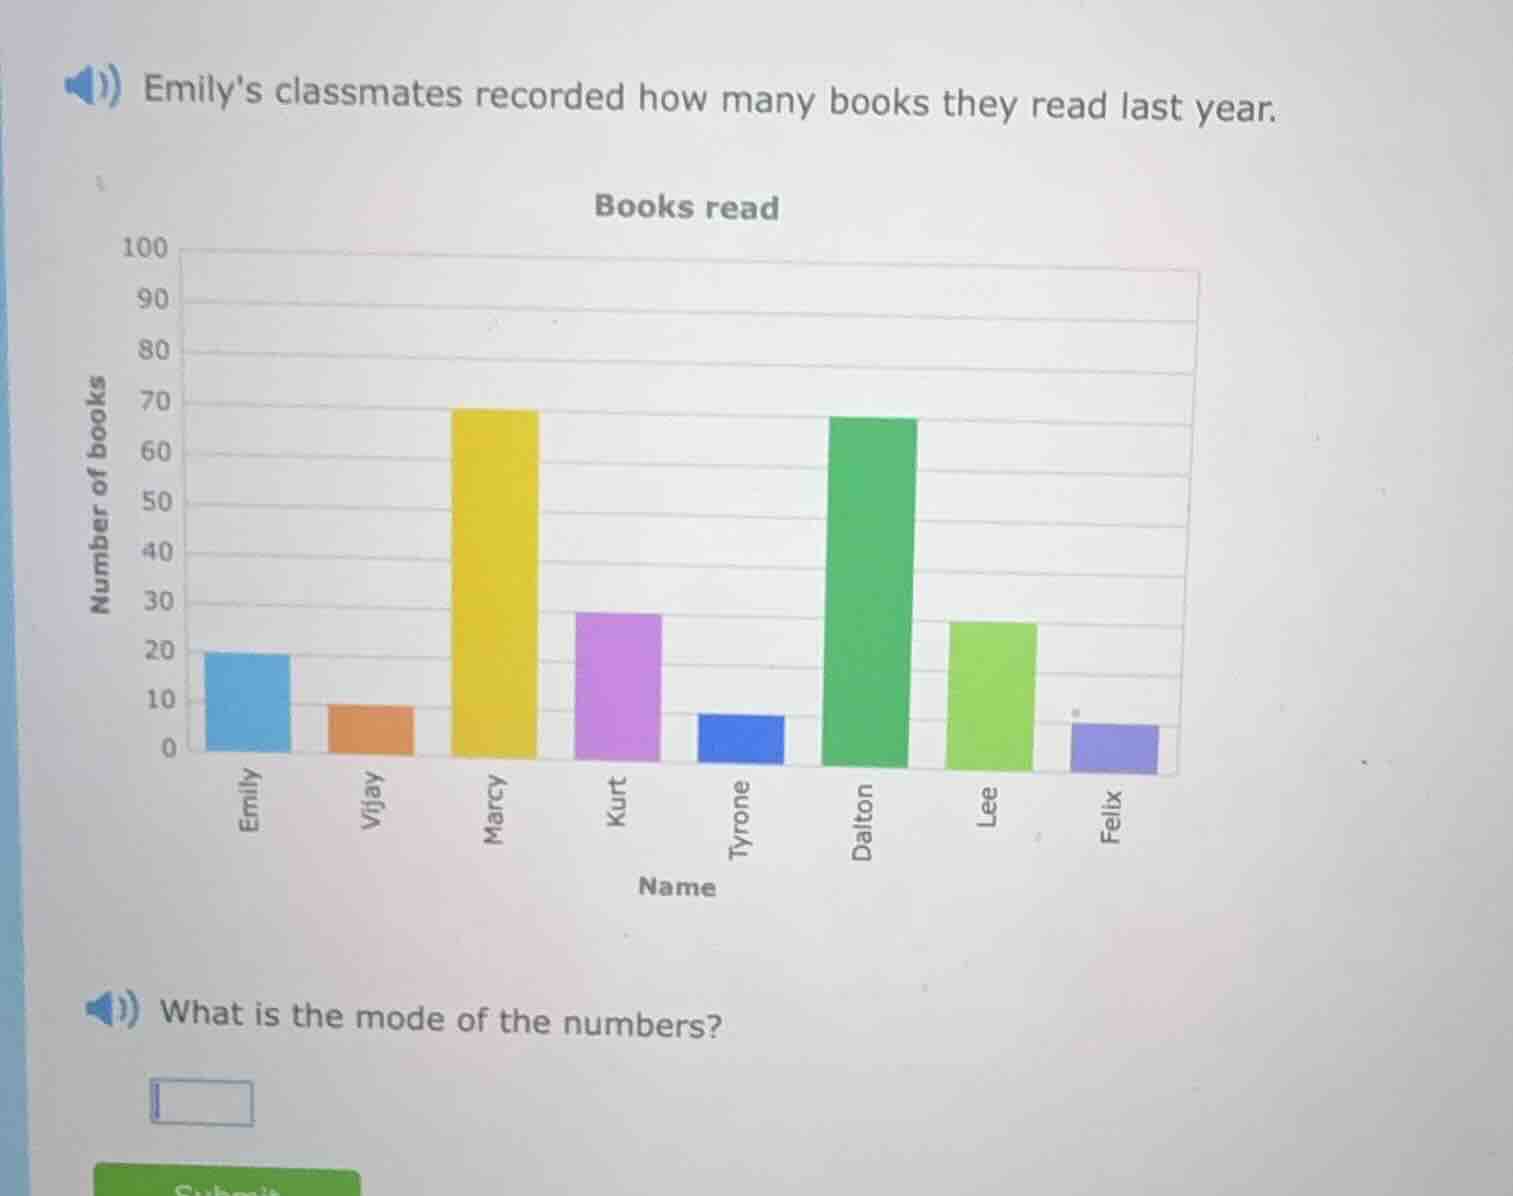
emilys classmates recorded how many books they read last year. books read what is the mode of the numbers?
Step1: Identify the number of books each read
From the bar graph:
- Emily: 20
- Vijay: 10
- Marcy: 70
- Kurt: 30
- Tyrone: 10
- Dalton: 70
- Lee: 30
- Felix: 10
Step2: Determine the mode
The mode is the number that appears most frequently.
Count the frequency of each number:
- 20: 1 time
- 10: 3 times (Vijay, Tyrone, Felix)
- 70: 2 times (Marcy, Dalton)
- 30: 2 times (Kurt, Lee)
So, 10 appears most frequently. Wait, no, wait: Wait, Marcy and Dalton have 70, Vijay, Tyrone, Felix have 10, Kurt and Lee have 30, Emily has 20. Wait, no, let's re - check:
Wait, Emily: 20, Vijay:10, Marcy:70, Kurt:30, Tyrone:10, Dalton:70, Lee:30, Felix:10.
So frequency of 10: 3 (Vijay, Tyrone, Felix)
Frequency of 70: 2 (Marcy, Dalton)
Frequency of 30: 2 (Kurt, Lee)
Frequency of 20:1 (Emily)
Wait, but wait, maybe I made a mistake. Wait, no, let's check again. Wait, the problem is to find the mode. Wait, but wait, 10 occurs 3 times, 70 occurs 2 times, 30 occurs 2 times, 20 occurs 1 time. But wait, another way: Wait, maybe I misread the graph. Wait, no, the bars: Emily's bar is at 20, Vijay at 10, Marcy at 70, Kurt at 30, Tyrone at 10, Dalton at 70, Lee at 30, Felix at 10. So 10 is the number with the highest frequency (3 times). Wait, but wait, maybe I made a mistake. Wait, no, let's count again:
Vijay:10, Tyrone:10, Felix:10 → 3 times.
Marcy:70, Dalton:70 → 2 times.
Kurt:30, Lee:30 → 2 times.
Emily:20 → 1 time.
So the mode is 10? Wait, but wait, no, wait, maybe I misread the graph. Wait, no, the problem is about the number of books read. Wait, but wait, another thought: Wait, maybe the graph is mis - interpreted. Wait, no, the y - axis is number of books, x - axis is names. So the height of the bar is the number of books. So Vijay, Tyrone, Felix have 10 books each. Marcy and Dalton have 70. Kurt and Lee have 30. Emily has 20. So the mode is 10? Wait, but wait, no, wait, 10 occurs 3 times, 70 occurs 2 times, 30 occurs 2 times, 20 occurs 1 time. So the mode is 10. Wait, but wait, maybe I made a mistake. Wait, no, let's check again.
Wait, no, wait a second, maybe I messed up the numbers. Wait, Marcy's bar is at 70, Dalton's bar is at 70. Vijay, Tyrone, Felix: their bars are at 10. Kurt and Lee: their bars are at 30. Emily:20. So the frequencies:
10: 3
70: 2
30: 2
20:1
So the mode is 10. Wait, but wait, the initial thought was wrong. Wait, but let's confirm the definition of mode: the value that appears most often in a set of data. So yes, 10 appears 3 times, which is more than any other number.
Wait, but wait, another way: Maybe I misread the graph. Let me check again. The bar for Vijay: up to 10, Tyrone: up to 10, Felix: up to 10. Marcy: up to 70, Dalton: up to 70. Kurt: up to 30, Lee: up to 30. Emily: up to 20. So yes, 10 is the mode.

Snap & solve any problem in the app
Get step-by-step solutions on Sovi AI
Photo-based solutions with guided steps
Explore more problems and detailed explanations
10