QUESTION IMAGE
Question
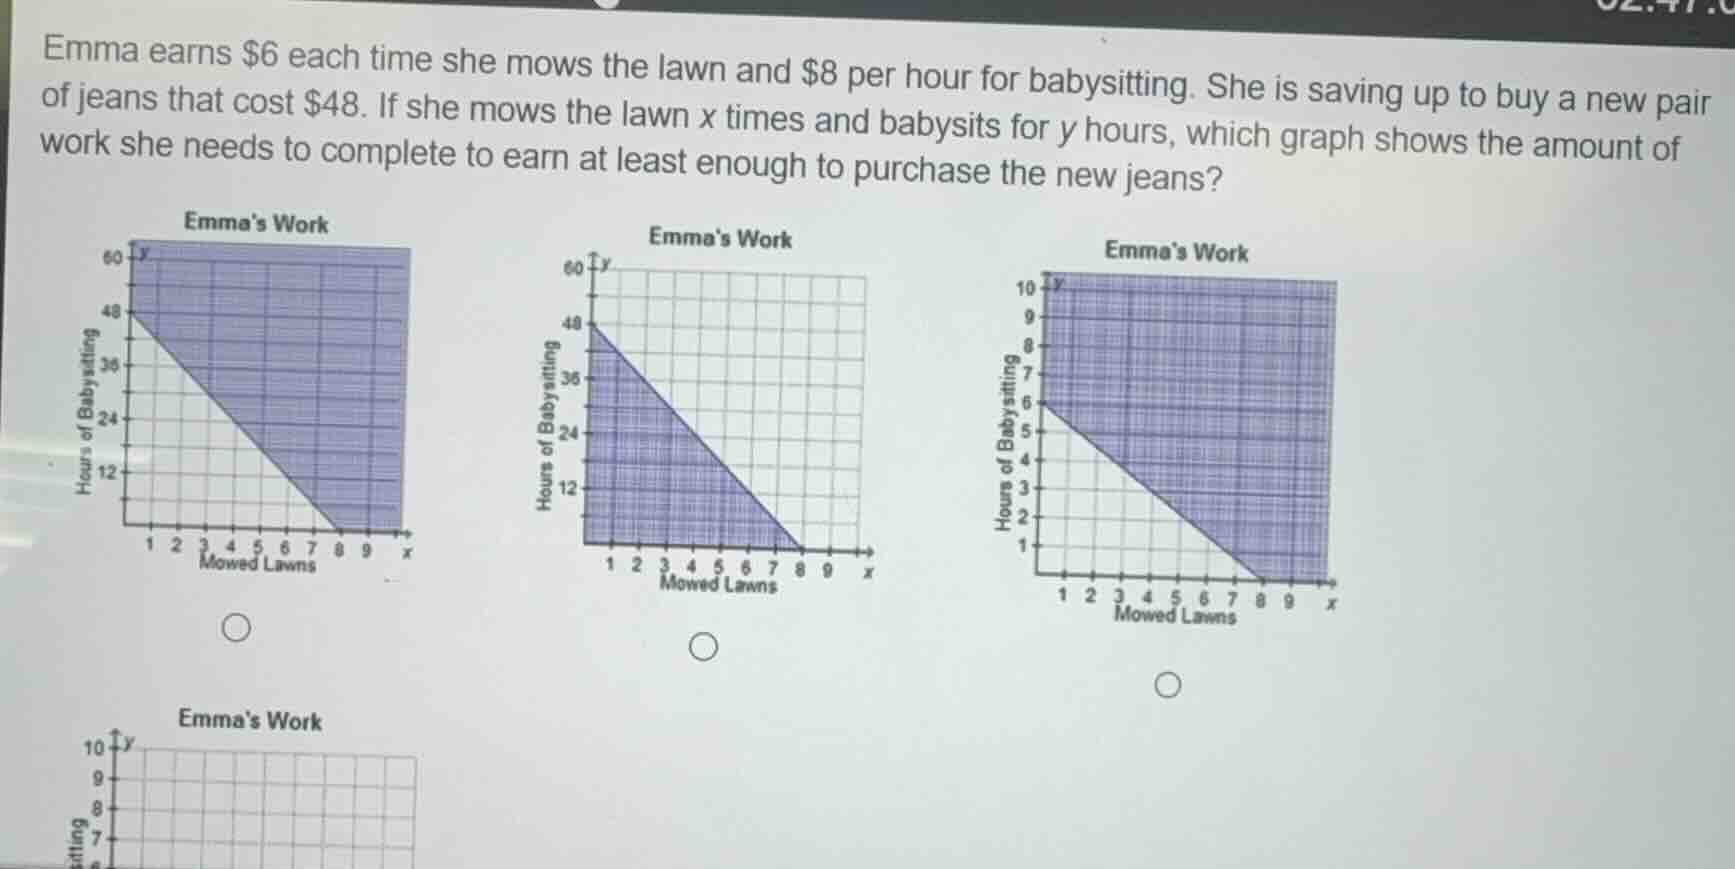
emma earns $6 each time she mows the lawn and $8 per hour for babysitting. she is saving up to buy a new pair of jeans that cost $48. if she mows the lawn x times and babysits for y hours, which graph shows the amount of work she needs to complete to earn at least enough to purchase the new jeans?
Step1: Define the inequality
$6x + 8y \geq 48$
Step2: Simplify the inequality
Divide all terms by 2: $3x + 4y \geq 24$
Step3: Find intercepts (x=0)
$4y \geq 24 \implies y \geq 6$ (y-intercept at (0,6))
Step4: Find intercepts (y=0)
$3x \geq 24 \implies x \geq 8$ (x-intercept at (8,0))
Step5: Determine shaded region
Since we need values that are at least $48$, we shade the region above the line (all points that satisfy the inequality).

Snap & solve any problem in the app
Get step-by-step solutions on Sovi AI
Photo-based solutions with guided steps
Explore more problems and detailed explanations
The correct graph is the third one (top right): it has a line connecting (0,6) and (8,0), with the region above/including the line shaded.