QUESTION IMAGE
Question
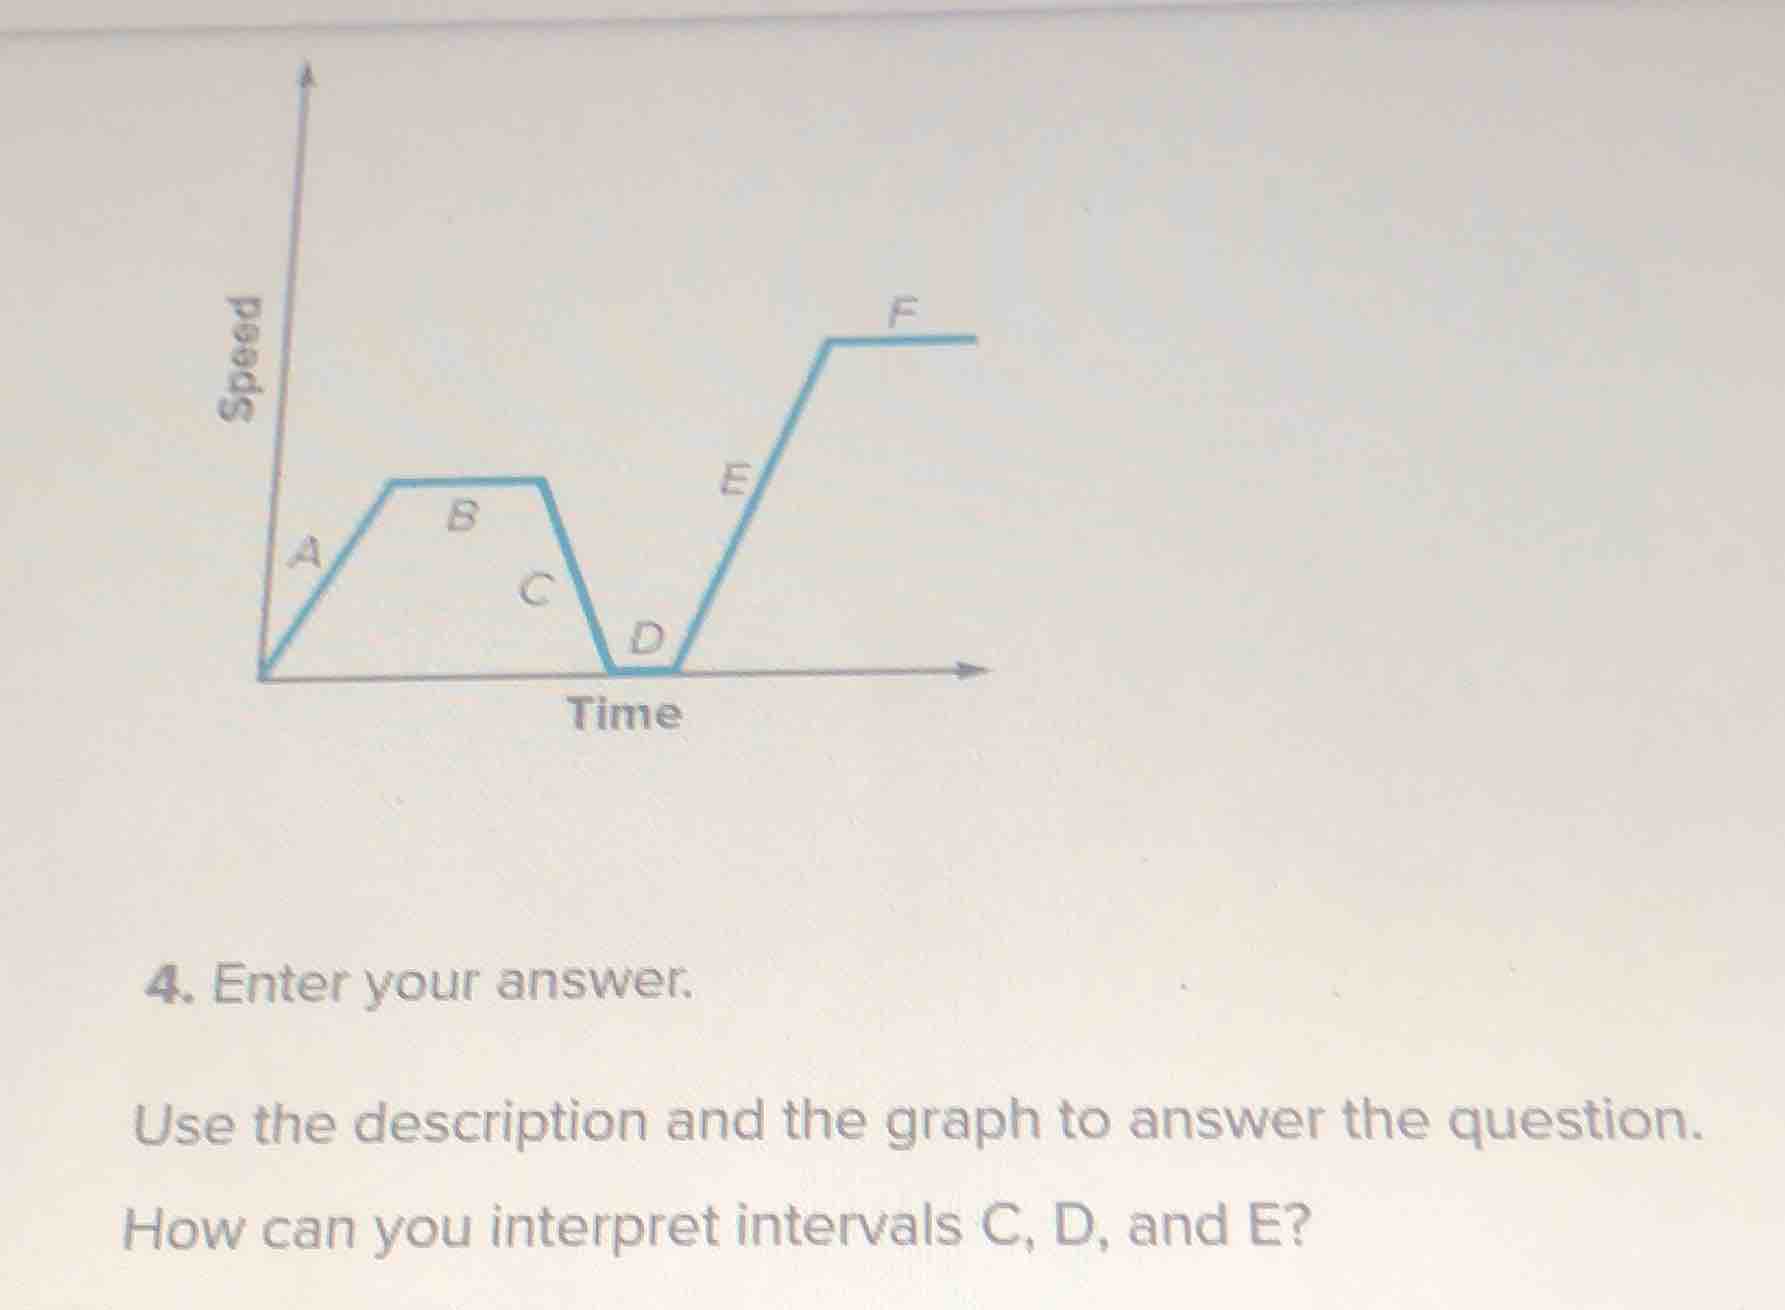
- enter your answer. use the description and the graph to answer the question. how can you interpret intervals c, d, and e?
Brief Explanations
- For interval C: The speed - time graph has a negative slope here, which means the speed is decreasing as time increases. So, this represents a deceleration (or negative acceleration) phase, where the object is slowing down.
- For interval D: The speed is zero (since the graph is on the time - axis) during this interval. This means the object is at rest (not moving) for the duration of interval D.
- For interval E: The speed - time graph has a positive slope here, which means the speed is increasing as time increases. So, this represents an acceleration (positive acceleration) phase, where the object is speeding up.

Snap & solve any problem in the app
Get step-by-step solutions on Sovi AI
Photo-based solutions with guided steps
Explore more problems and detailed explanations
- Interval C: The object is decelerating (slowing down).
- Interval D: The object is at rest (not moving).
- Interval E: The object is accelerating (speeding up).