QUESTION IMAGE
15,772 Learners found this answer helpful
Question
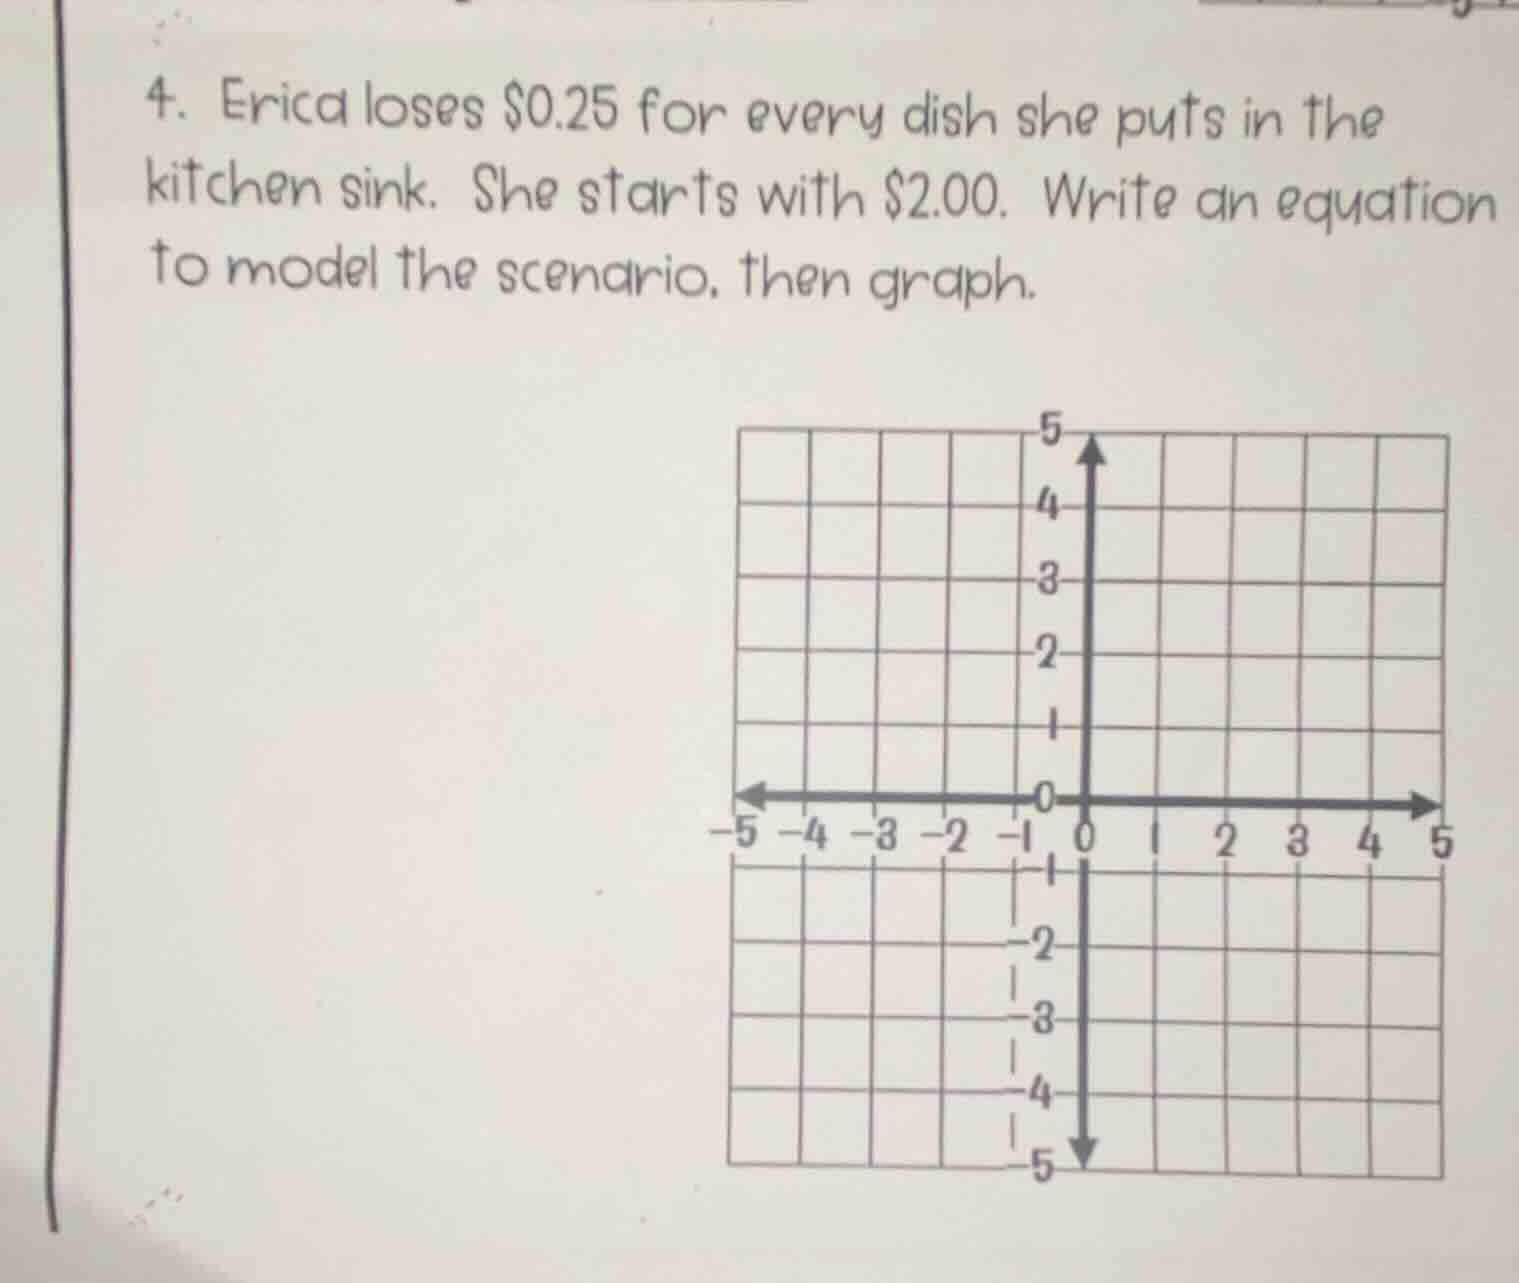
- erica loses $0.25 for every dish she puts in the kitchen sink. she starts with $2.00. write an equation to model the scenario, then graph.
Step1: Define variables
Let $x$ = number of dishes, $y$ = remaining money.
Step2: Identify initial value
Initial money (y-intercept) $b = 2.00$
Step3: Identify rate of change
Loss per dish (slope) $m = -0.25$
Step4: Write linear equation
Use slope-intercept form $y = mx + b$
$y = -0.25x + 2.00$
Step5: Find graph points
- When $x=0$, $y=2.00$ → Point $(0, 2)$
- When $y=0$, $0 = -0.25x + 2$ → $x = \frac{2}{0.25} = 8$ → Point $(8, 0)$
(Note: The provided grid only shows up to $x=5$, so plot $(0,2)$ and $(5, 2 - 0.25*5) = (5, 0.75)$ for the visible grid.)

Snap & solve any problem in the app
Get step-by-step solutions on Sovi AI
Photo-based solutions with guided steps
Explore more problems and detailed explanations
Equation: $\boldsymbol{y = -0.25x + 2}$
Graph: Plot the points $(0, 2)$ and $(5, 0.75)$ on the grid, then draw a straight line through them (extending to $x=8$ off the provided grid where $y=0$).