QUESTION IMAGE
Question
error analysis
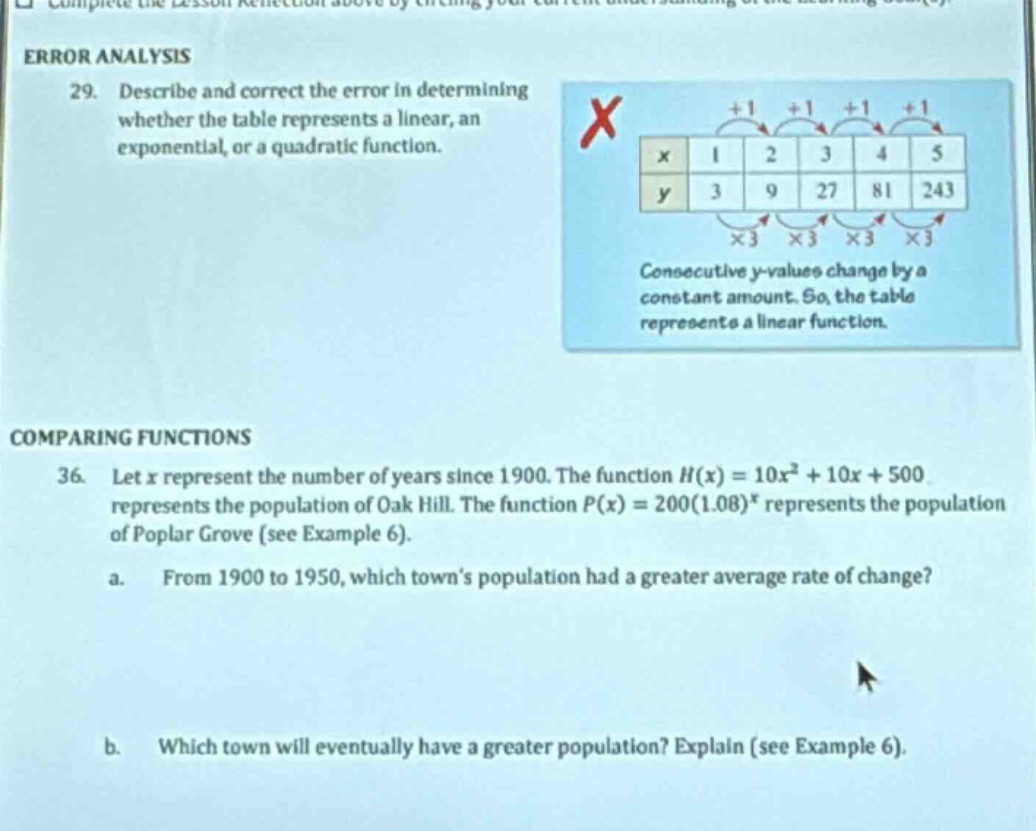
- describe and correct the error in determining whether the table represents a linear, an exponential, or a quadratic function.
comparing functions
- let x represent the number of years since 1900. the function $h(x) = 10x^2 + 10x + 500$ represents the population of oak hill. the function $p(x) = 200(1.08)^x$ represents the population of poplar grove (see example 6).
a. from 1900 to 1950, which town’s population had a greater average rate of change?
b. which town will eventually have a greater population? explain (see example 6).
Problem 29
Step1: Identify y-value change pattern
Check ratio of consecutive y-values:
$\frac{9}{3}=3$, $\frac{27}{9}=3$, $\frac{81}{27}=3$, $\frac{243}{81}=3$
Step2: Correct function classification
Linear functions have constant difference in y-values; exponential functions have constant ratio in y-values.
Step1: Define x for 1950
$x = 1950 - 1900 = 50$
Step2: Calculate Oak Hill population
$H(0) = 10(0)^2 + 10(0) + 500 = 500$
$H(50) = 10(50)^2 + 10(50) + 500 = 10(2500) + 500 + 500 = 26000$
Average rate of change: $\frac{H(50)-H(0)}{50-0} = \frac{26000-500}{50} = \frac{25500}{50} = 510$
Step3: Calculate Poplar Grove population
$P(0) = 200(1.08)^0 = 200$
$P(50) = 200(1.08)^{50} \approx 200(46.9016) = 9380.32$
Average rate of change: $\frac{P(50)-P(0)}{50-0} = \frac{9380.32-200}{50} = \frac{9180.32}{50} \approx 183.61$
Step4: Compare the two rates
$510 > 183.61$
Step1: Analyze function growth types
$H(x)$ is a quadratic function (polynomial, grows polynomially); $P(x)$ is an exponential function with base $1.08 > 1$.
Step2: Compare long-term growth
Exponential functions with a base greater than 1 will eventually outpace any polynomial function, regardless of the polynomial's degree.

Snap & solve any problem in the app
Get step-by-step solutions on Sovi AI
Photo-based solutions with guided steps
Explore more problems and detailed explanations
The error is claiming the function is linear: consecutive y-values change by a constant ratio (×3), not a constant amount. The table represents an exponential function.
---