QUESTION IMAGE
Question
example 1
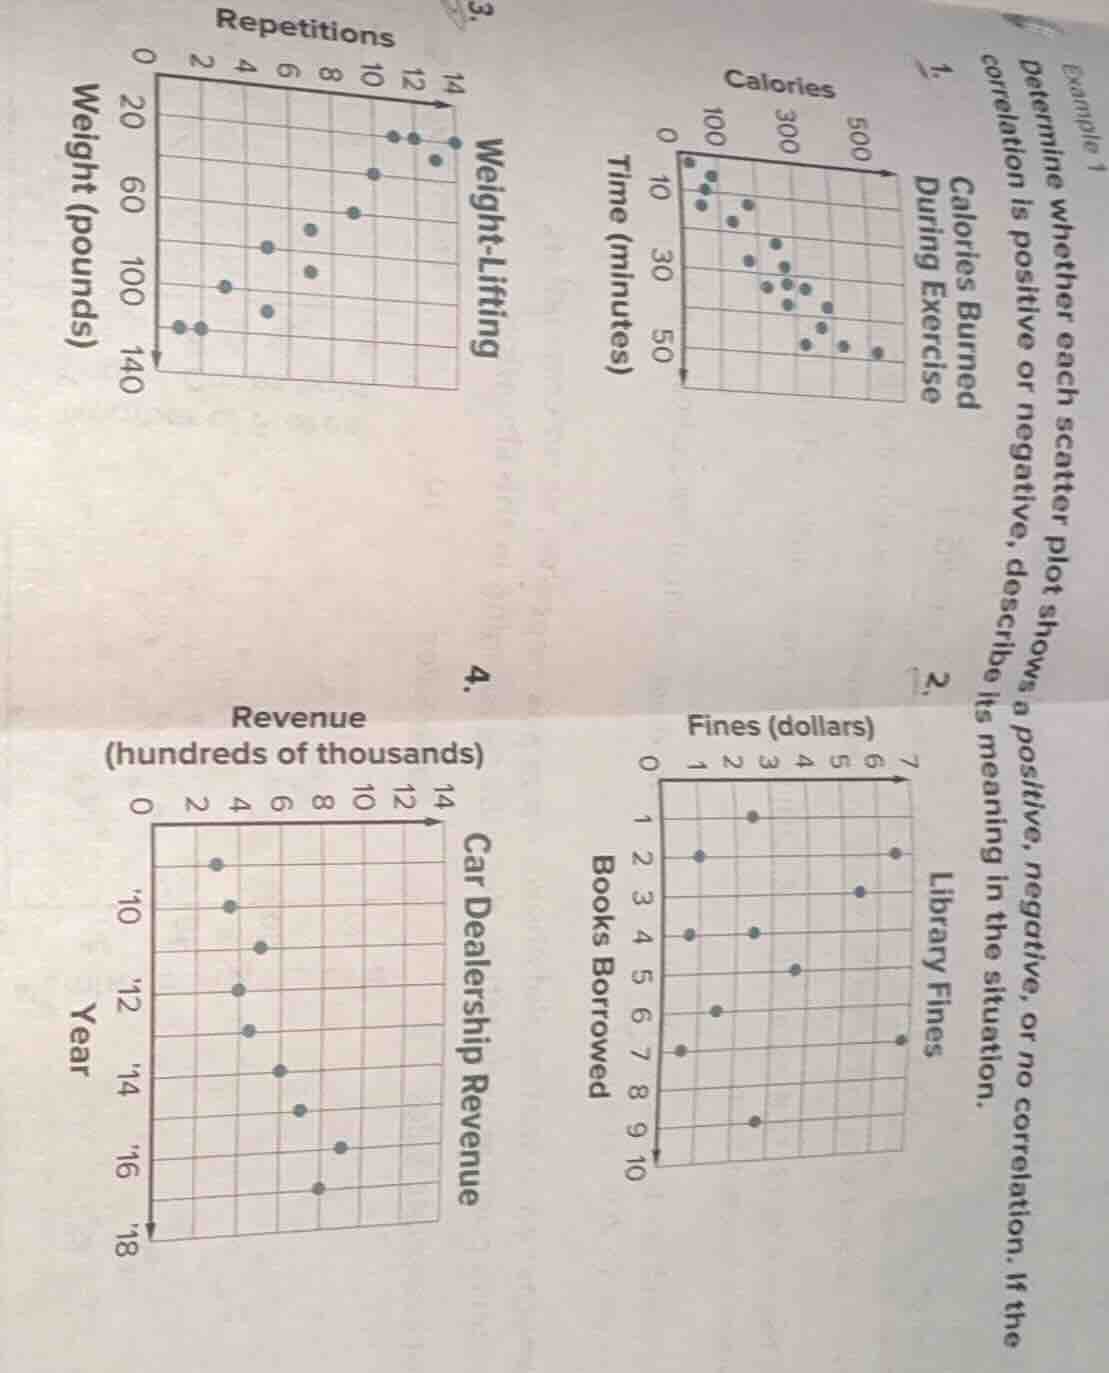
determine whether each scatter plot shows a positive, negative, or no correlation. if the correlation is positive or negative, describe its meaning in the situation.
- calories burned during exercise
- library fines
- weight-lifting
- car dealership revenue
Brief Explanations
- For the "Calories Burned During Exercise" scatter plot: As time (minutes) increases, calories burned decrease, so this is a negative correlation.
- For the "Library Fines" scatter plot: There is no clear upward or downward trend between number of books borrowed and fines, so this is no correlation.
- For the "Weight-Lifting" scatter plot: As weight (pounds) increases, number of repetitions increases, so this is a positive correlation.
- For the "Car Dealership Revenue" scatter plot: As the year increases, revenue (hundreds of thousands) increases, so this is a positive correlation.

Snap & solve any problem in the app
Get step-by-step solutions on Sovi AI
Photo-based solutions with guided steps
Explore more problems and detailed explanations
- Negative correlation: As exercise time increases, calories burned decrease.
- No correlation: There is no consistent relationship between number of books borrowed and library fines.
- Positive correlation: As weight lifted increases, number of repetitions increases.
- Positive correlation: As the year progresses, car dealership revenue increases.