QUESTION IMAGE
Question
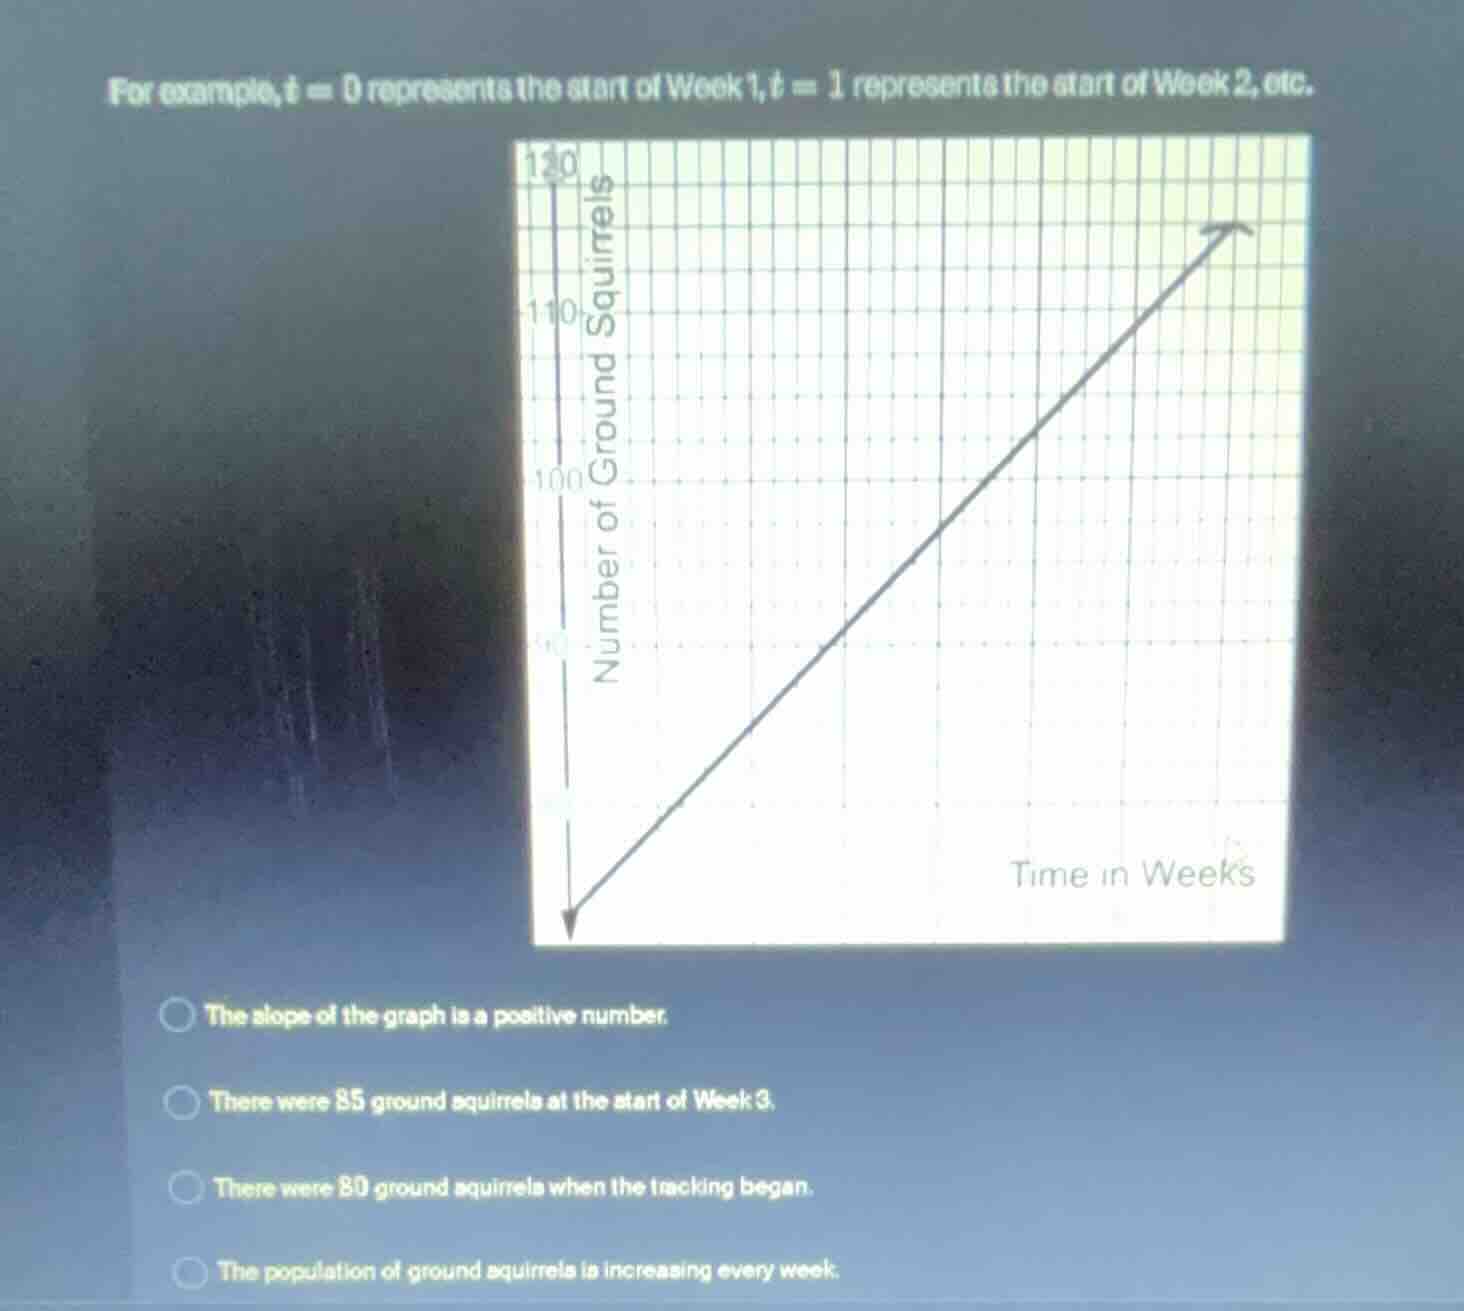
for example, t = 0 represents the start of week 1, t = 1 represents the start of week 2, etc.
the slope of the graph is a positive number.
there were 85 ground squirrels at the start of week 3.
there were 80 ground squirrels when the tracking began.
the population of ground squirrels is increasing every week.
Brief Explanations
- Positive slope check: The line rises from left to right, so its slope is positive. This statement is true.
- Start of Week 3 check: Start of Week 3 corresponds to $t=2$. The graph shows at $t=2$, the population is 80, not 85. This statement is false.
- Tracking start check: Tracking begins at $t=0$ (start of Week 1), where the graph shows the population is 80. This statement is true.
- Population increase check: The line has a positive slope, meaning the population rises each week. This statement is true.

Snap & solve any problem in the app
Get step-by-step solutions on Sovi AI
Photo-based solutions with guided steps
Explore more problems and detailed explanations
There were 85 ground squirrels at the start of Week 3.