QUESTION IMAGE
Question
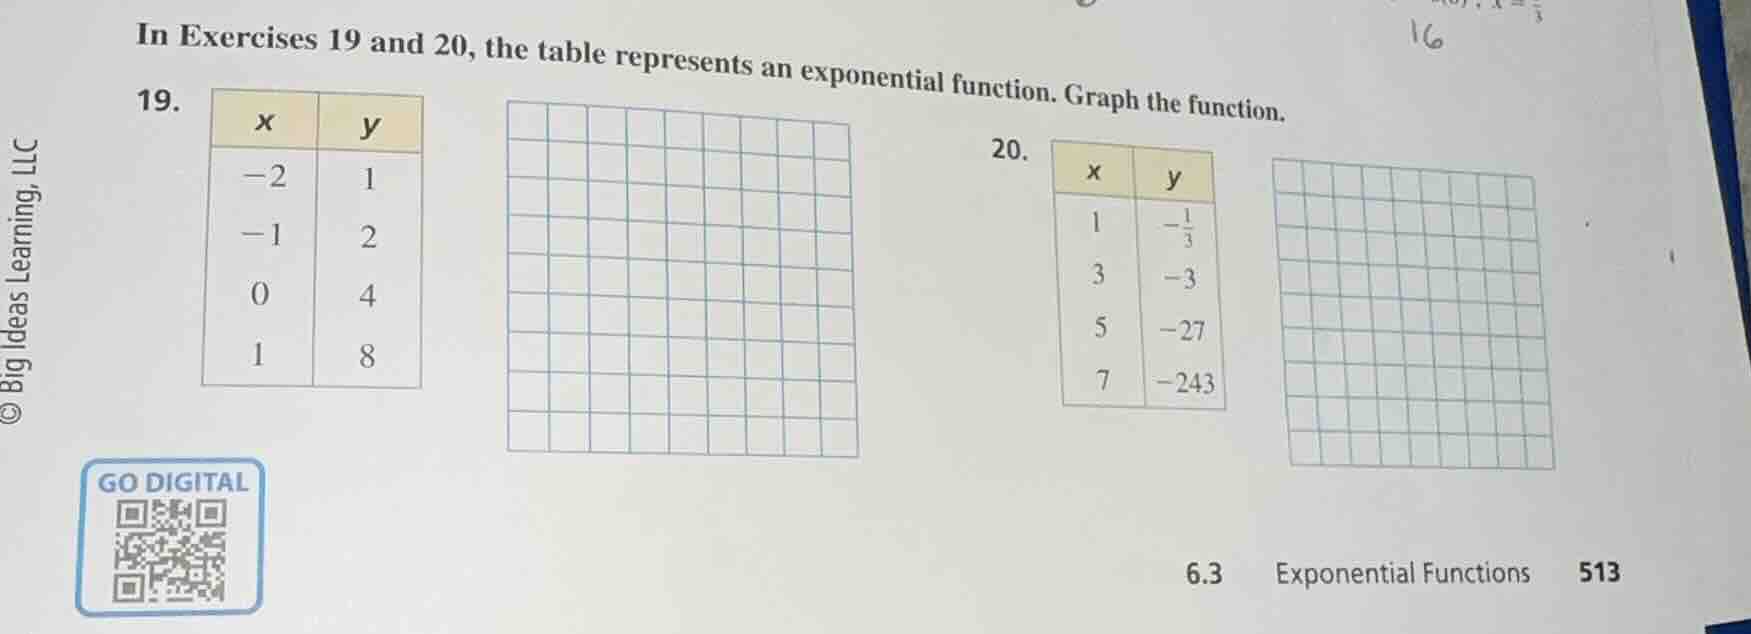
in exercises 19 and 20, the table represents an exponential function. graph the function. 19.
| x | y |
| -2 | 1 |
| -1 | 2 |
| 0 | 4 |
| 1 | 8 |
20.
| x | y |
| 1 | -\frac{1}{3} |
| 3 | -3 |
| 5 | -27 |
| 7 | -243 |
Problem 19:
Step 1: Identify the exponential function form
The general form of an exponential function is \( y = ab^x \). We can use the given points to find \( a \) and \( b \). When \( x = 0 \), \( y = 4 \). Substituting into the formula: \( 4 = ab^0 \), and since \( b^0 = 1 \), we get \( a = 4 \).
Step 2: Find the base \( b \)
Now use another point, say \( x = 1 \), \( y = 8 \). Substitute \( a = 4 \), \( x = 1 \), \( y = 8 \) into \( y = 4b^x \): \( 8 = 4b^1 \), so \( b = \frac{8}{4} = 2 \). So the function is \( y = 4(2)^x \).
Step 3: Plot the points
The given points are \( (-2, 1) \), \( (-1, 2) \), \( (0, 4) \), \( (1, 8) \). For \( x = -2 \), \( y = 4(2)^{-2} = 4(\frac{1}{4}) = 1 \) (matches). For \( x = -1 \), \( y = 4(2)^{-1} = 4(\frac{1}{2}) = 2 \) (matches). Now, plot these points on the coordinate grid: mark \( (-2, 1) \), \( (-1, 2) \), \( (0, 4) \), \( (1, 8) \), and draw a smooth curve through them, since it's an exponential function (it should increase as \( x \) increases, and approach the x - axis as \( x \) decreases).
Problem 20:
Step 1: Identify the exponential function form (adjusted for odd x - values)
The x - values are 1, 3, 5, 7 (differ by 2). Let's let \( t=\frac{x - 1}{2} \), so when \( x = 1 \), \( t = 0 \); \( x = 3 \), \( t = 1 \); \( x = 5 \), \( t = 2 \); \( x = 7 \), \( t = 3 \). The general form can be written as \( y = ab^t \). When \( t = 0 \) (x = 1), \( y=-\frac{1}{3} \), so \( a = -\frac{1}{3} \).
Step 2: Find the base \( b \)
Use \( t = 1 \) (x = 3), \( y=-3 \). Substitute into \( y = -\frac{1}{3}b^t \): \( -3=-\frac{1}{3}b^1 \), so \( b=\frac{-3}{-\frac{1}{3}} = 9 \)? Wait, no, wait. Wait, when \( x = 3 \), \( t = 1 \), \( y=-3 \). Wait, maybe another approach. Let's see the ratio between y - values. From \( x = 1 \) (y = -1/3) to \( x = 3 \) (y = -3): the ratio is \( \frac{-3}{-\frac{1}{3}}=9 \). From \( x = 3 \) (y = -3) to \( x = 5 \) (y = -27): ratio is \( \frac{-27}{-3}=9 \). From \( x = 5 \) (y = -27) to \( x = 7 \) (y = -243): ratio is \( \frac{-243}{-27}=9 \). Since the x - values increase by 2 each time, the base for the exponent (with respect to the step of 2 in x) is 9, but if we consider the exponent as \( \frac{x - 1}{2} \), the function is \( y = -\frac{1}{3}(9)^{\frac{x - 1}{2}}=-\frac{1}{3}(3)^{x - 1} \) (since \( 9^{\frac{1}{2}} = 3 \)). Let's check: when \( x = 1 \), \( y=-\frac{1}{3}(3)^{0}=-\frac{1}{3} \) (matches). When \( x = 3 \), \( y=-\frac{1}{3}(3)^{2}=-\frac{1}{3}(9)=-3 \) (matches). When \( x = 5 \), \( y=-\frac{1}{3}(3)^{4}=-\frac{1}{3}(81)=-27 \) (matches). When \( x = 7 \), \( y=-\frac{1}{3}(3)^{6}=-\frac{1}{3}(729)=-243 \) (matches). So the function is \( y = -\frac{1}{3}(3)^{x - 1} \) or \( y=-3^{x - 2} \) (since \( -\frac{1}{3}(3)^{x - 1}= - 3^{x - 2} \)).
Step 3: Plot the points
The given points are \( (1, -\frac{1}{3}) \), \( (3, -3) \), \( (5, -27) \), \( (7, -243) \). Plot these points on the coordinate grid. Since the x - values are odd and spaced by 2, and the y - values are negative and increasing in magnitude (more negative) as x increases, draw a smooth curve through these points, noting the exponential decay/growth (in this case, growth in magnitude, negative direction) pattern.
Graphing Instructions (General for both):
- For problem 19, the points are relatively close, so the curve will rise from left to right, passing through the plotted points.
- For problem 20, the y - values get very negative as x increases, so the curve will go down sharply as x moves to the right from 1 to 7, passing through the given points.
(Note: Since the question says "Graph the function", the main steps are finding the function (to confirm the shape) and plotting the given points, then drawing the exponential curve through them. The above steps explain how to determine the function and plot the points for graphing.)

Snap & solve any problem in the app
Get step-by-step solutions on Sovi AI
Photo-based solutions with guided steps
Explore more problems and detailed explanations
Step 1: Identify the exponential function form (adjusted for odd x - values)
The x - values are 1, 3, 5, 7 (differ by 2). Let's let \( t=\frac{x - 1}{2} \), so when \( x = 1 \), \( t = 0 \); \( x = 3 \), \( t = 1 \); \( x = 5 \), \( t = 2 \); \( x = 7 \), \( t = 3 \). The general form can be written as \( y = ab^t \). When \( t = 0 \) (x = 1), \( y=-\frac{1}{3} \), so \( a = -\frac{1}{3} \).
Step 2: Find the base \( b \)
Use \( t = 1 \) (x = 3), \( y=-3 \). Substitute into \( y = -\frac{1}{3}b^t \): \( -3=-\frac{1}{3}b^1 \), so \( b=\frac{-3}{-\frac{1}{3}} = 9 \)? Wait, no, wait. Wait, when \( x = 3 \), \( t = 1 \), \( y=-3 \). Wait, maybe another approach. Let's see the ratio between y - values. From \( x = 1 \) (y = -1/3) to \( x = 3 \) (y = -3): the ratio is \( \frac{-3}{-\frac{1}{3}}=9 \). From \( x = 3 \) (y = -3) to \( x = 5 \) (y = -27): ratio is \( \frac{-27}{-3}=9 \). From \( x = 5 \) (y = -27) to \( x = 7 \) (y = -243): ratio is \( \frac{-243}{-27}=9 \). Since the x - values increase by 2 each time, the base for the exponent (with respect to the step of 2 in x) is 9, but if we consider the exponent as \( \frac{x - 1}{2} \), the function is \( y = -\frac{1}{3}(9)^{\frac{x - 1}{2}}=-\frac{1}{3}(3)^{x - 1} \) (since \( 9^{\frac{1}{2}} = 3 \)). Let's check: when \( x = 1 \), \( y=-\frac{1}{3}(3)^{0}=-\frac{1}{3} \) (matches). When \( x = 3 \), \( y=-\frac{1}{3}(3)^{2}=-\frac{1}{3}(9)=-3 \) (matches). When \( x = 5 \), \( y=-\frac{1}{3}(3)^{4}=-\frac{1}{3}(81)=-27 \) (matches). When \( x = 7 \), \( y=-\frac{1}{3}(3)^{6}=-\frac{1}{3}(729)=-243 \) (matches). So the function is \( y = -\frac{1}{3}(3)^{x - 1} \) or \( y=-3^{x - 2} \) (since \( -\frac{1}{3}(3)^{x - 1}= - 3^{x - 2} \)).
Step 3: Plot the points
The given points are \( (1, -\frac{1}{3}) \), \( (3, -3) \), \( (5, -27) \), \( (7, -243) \). Plot these points on the coordinate grid. Since the x - values are odd and spaced by 2, and the y - values are negative and increasing in magnitude (more negative) as x increases, draw a smooth curve through these points, noting the exponential decay/growth (in this case, growth in magnitude, negative direction) pattern.
Graphing Instructions (General for both):
- For problem 19, the points are relatively close, so the curve will rise from left to right, passing through the plotted points.
- For problem 20, the y - values get very negative as x increases, so the curve will go down sharply as x moves to the right from 1 to 7, passing through the given points.
(Note: Since the question says "Graph the function", the main steps are finding the function (to confirm the shape) and plotting the given points, then drawing the exponential curve through them. The above steps explain how to determine the function and plot the points for graphing.)