QUESTION IMAGE
Question
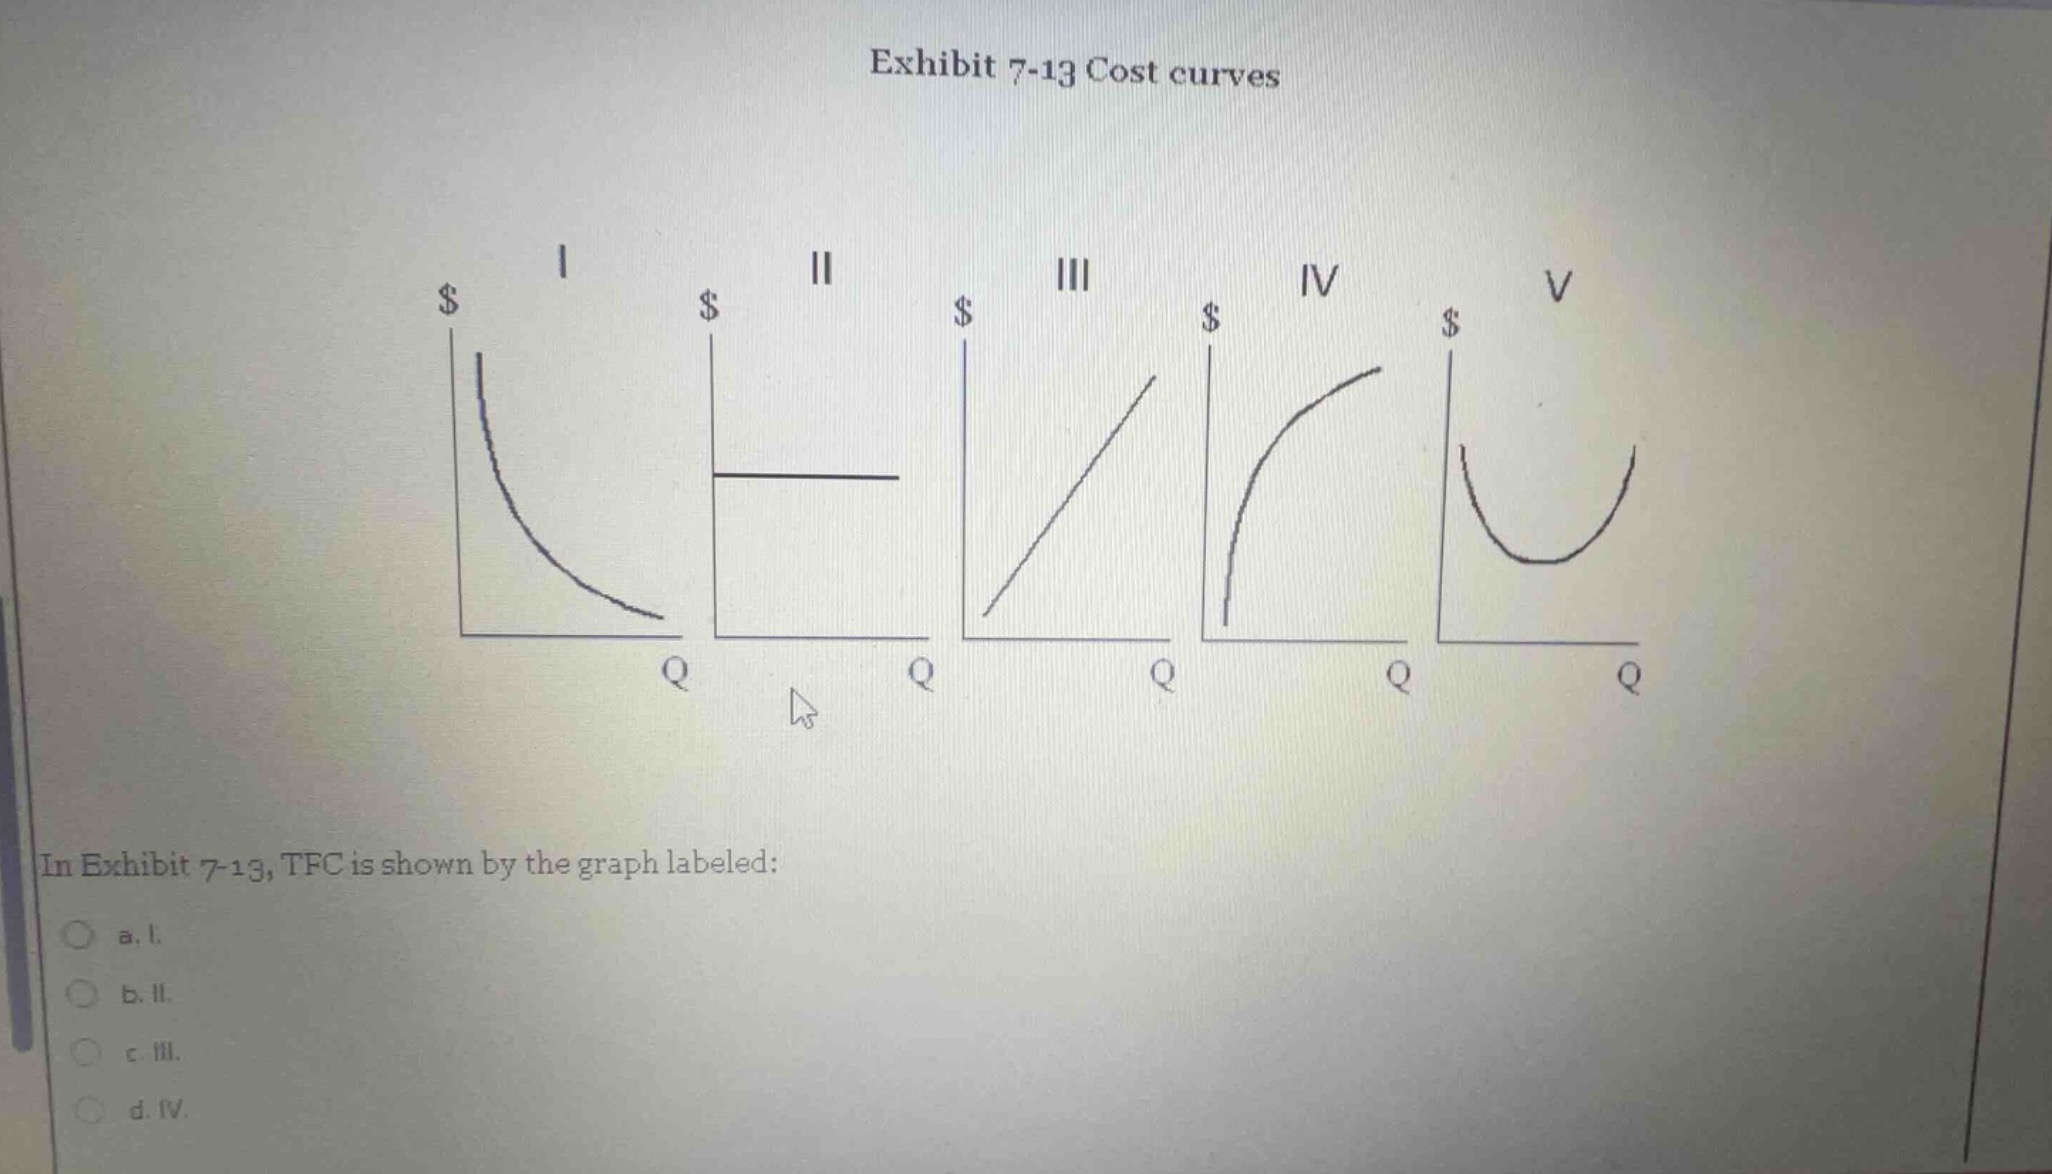
exhibit 7-13 cost curves
in exhibit 7-13, tfc is shown by the graph labeled:
a. i.
b. ii.
c. iii.
d. iv.
Brief Explanations
TFC (Total Fixed Cost) is a cost that does not change with the quantity of output (Q) produced. This means it is represented by a horizontal line on a cost-quantity graph, as it remains the same at all levels of output. Graph II is the only horizontal line, so it corresponds to TFC.

Snap & solve any problem in the app
Get step-by-step solutions on Sovi AI
Photo-based solutions with guided steps
Explore more problems and detailed explanations
b. II.