QUESTION IMAGE
Question
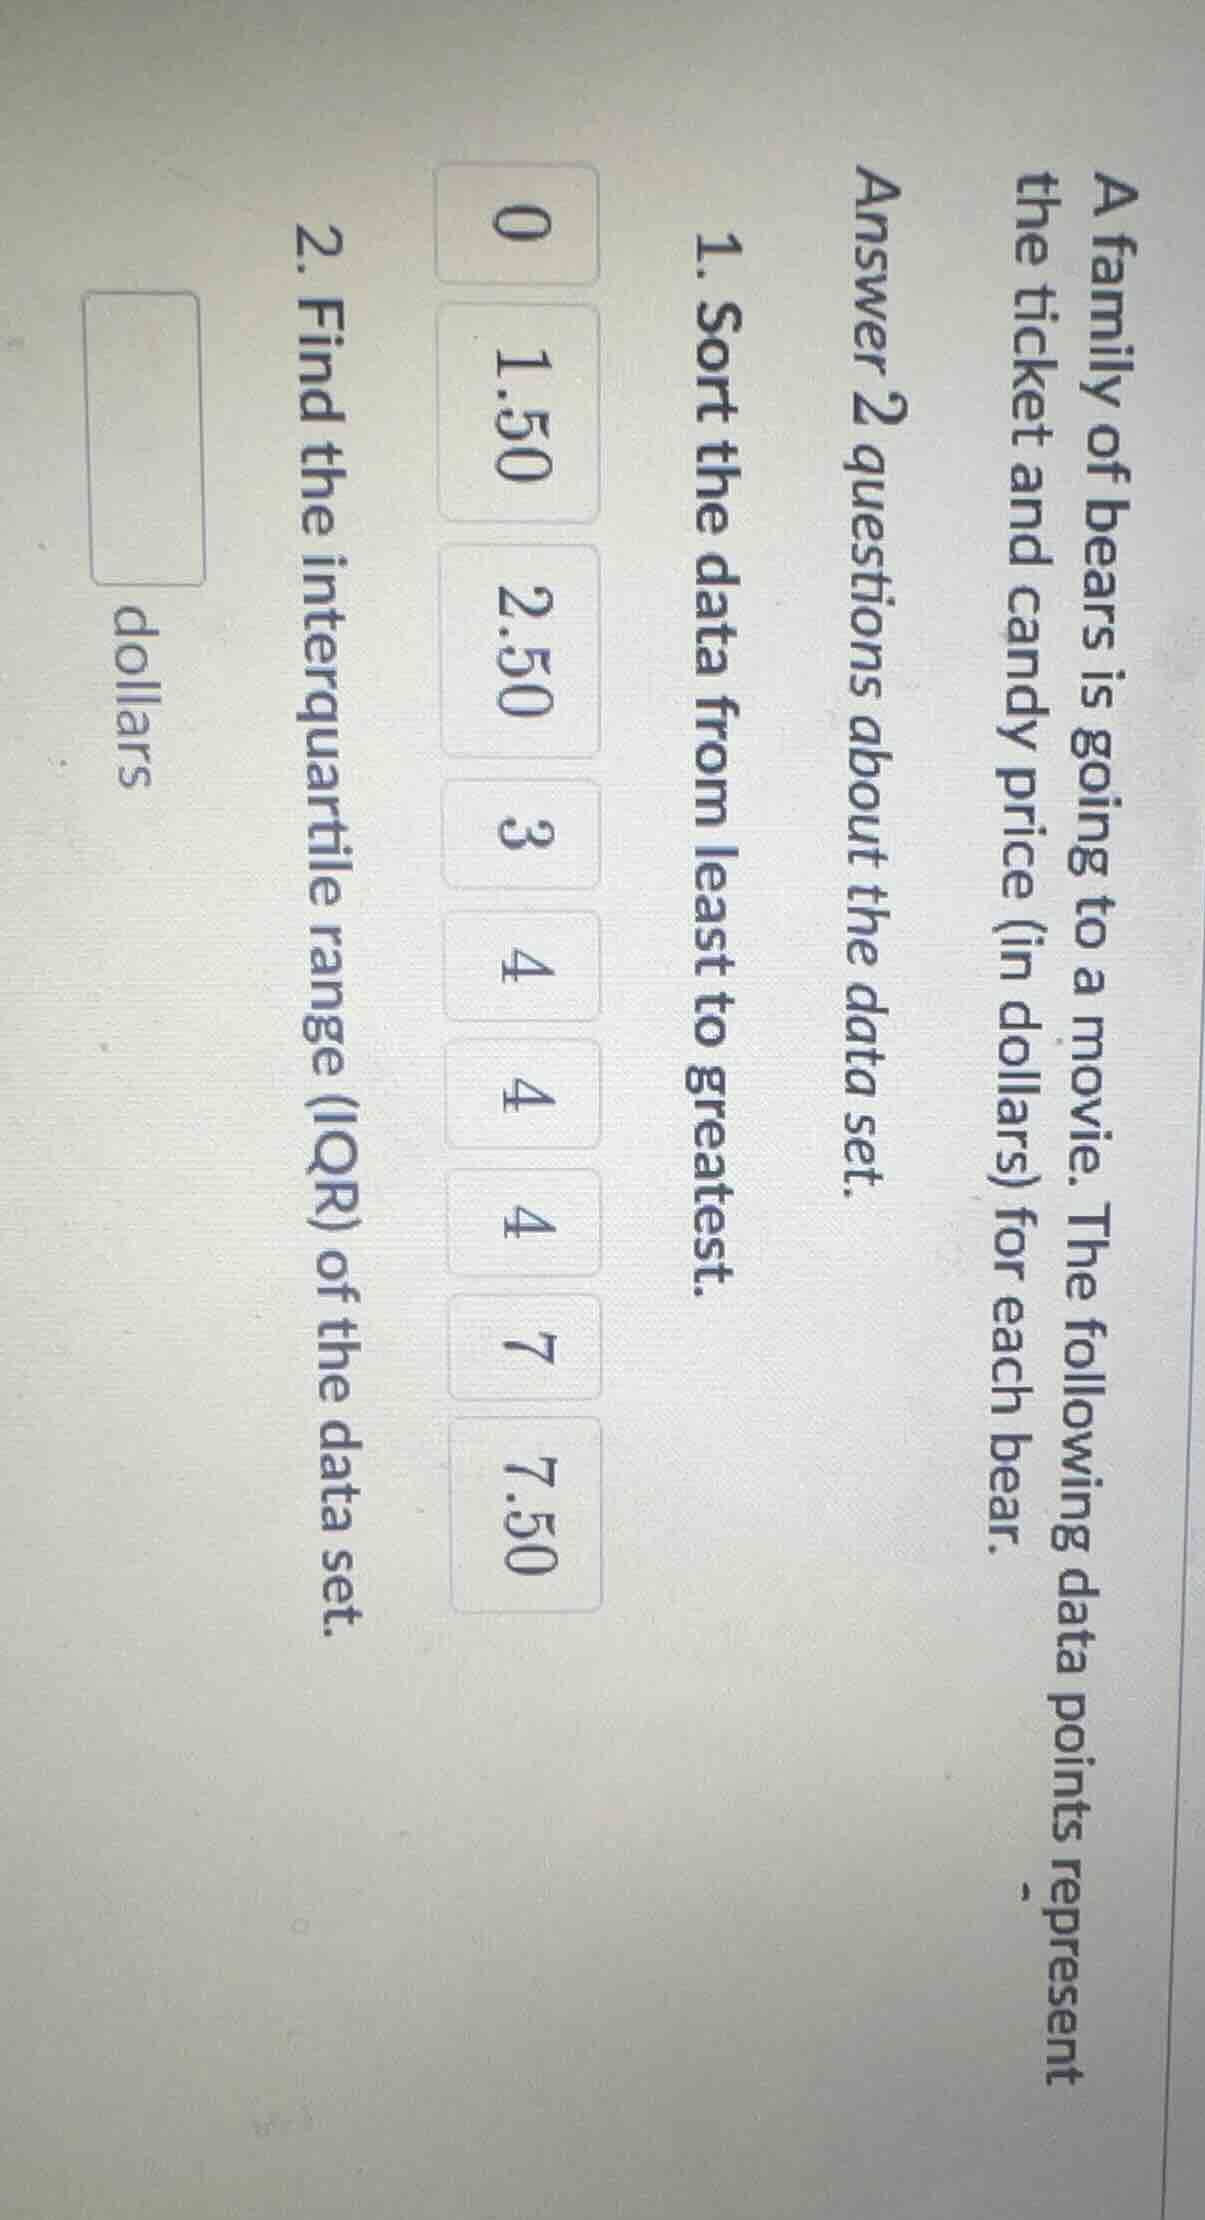
a family of bears is going to a movie. the following data points represent the ticket and candy price (in dollars) for each bear. answer 2 questions about the data set. 1. sort the data from least to greatest. 0 1.50 2.50 3 4 4 4 7 7.50 2. find the interquartile range (iqr) of the data set. dollars
1. Sort the data from least to greatest
Step1: Identify the data points
The data points are \( 0, 1.50, 2.50, 3, 4, 4, 4, 7, 7.50 \).
Step2: Arrange in ascending order
We sort them by comparing each value. The sorted data is \( 0, 1.50, 2.50, 3, 4, 4, 4, 7, 7.50 \).
Step1: Find the median (Q2)
The data set has \( n = 9 \) values. The median is the middle value. For \( n = 9 \), the median is the \( \frac{9 + 1}{2}= 5^{\text{th}} \) value. The sorted data is \( 0, 1.50, 2.50, 3, 4, 4, 4, 7, 7.50 \), so the median (Q2) is \( 4 \).
Step2: Find the lower quartile (Q1)
The lower half of the data is \( 0, 1.50, 2.50, 3 \) (values before the median). The median of this lower half (Q1) is the average of the \( 2^{\text{nd}} \) and \( 3^{\text{rd}} \) values (since \( n = 4 \) for the lower half, median is \( \frac{2^{\text{nd}} + 3^{\text{rd}}}{2} \)). So \( Q1=\frac{1.50 + 2.50}{2}=\frac{4}{2}= 2 \).
Step3: Find the upper quartile (Q3)
The upper half of the data is \( 4, 4, 7, 7.50 \) (values after the median). The median of this upper half (Q3) is the average of the \( 2^{\text{nd}} \) and \( 3^{\text{rd}} \) values (since \( n = 4 \) for the upper half, median is \( \frac{2^{\text{nd}} + 3^{\text{rd}}}{2} \)). So \( Q3=\frac{4 + 7}{2}=\frac{11}{2}= 5.5 \).
Step4: Calculate IQR
The interquartile range is \( IQR = Q3 - Q1 \). Substituting the values of Q3 and Q1, we get \( IQR=5.5 - 2 = 3.5 \).

Snap & solve any problem in the app
Get step-by-step solutions on Sovi AI
Photo-based solutions with guided steps
Explore more problems and detailed explanations
\( 0, 1.50, 2.50, 3, 4, 4, 4, 7, 7.50 \)