QUESTION IMAGE
Question
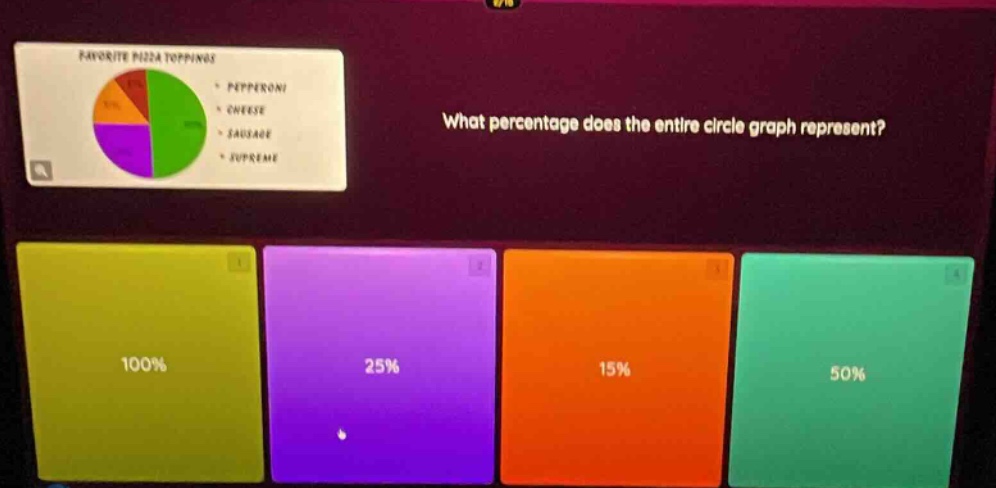
favorite pizza toppings pepperoni cheese sausage supreme what percentage does the entire circle graph represent? 100% 25% 15% 50%
Brief Explanations
A circle graph (pie chart) is designed to represent a complete set of data, where the entire circle corresponds to the total of all categories being measured. By definition, this total is equivalent to 100% of the dataset.

Snap & solve any problem in the app
Get step-by-step solutions on Sovi AI
Photo-based solutions with guided steps
Explore more problems and detailed explanations
A. 100%