QUESTION IMAGE
Question
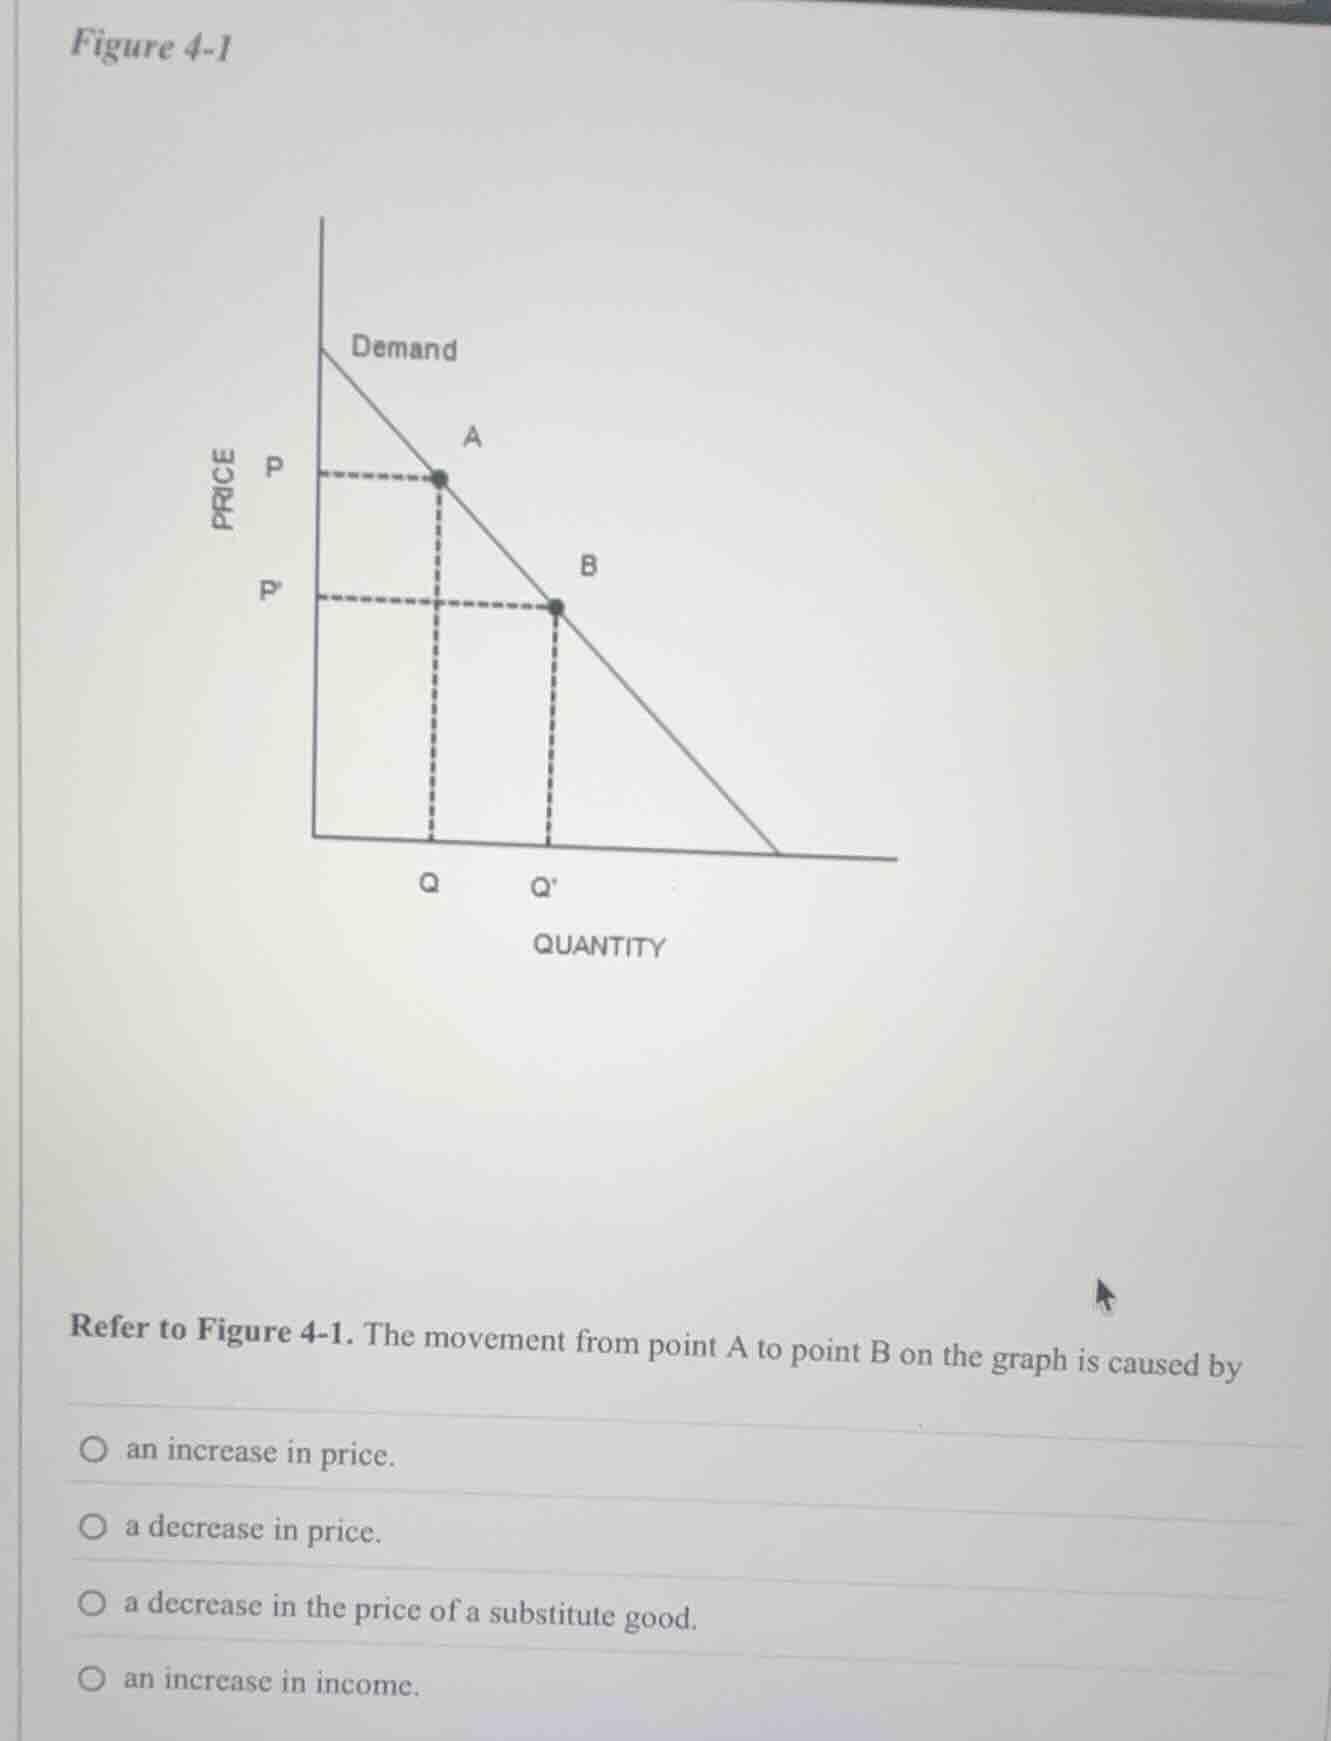
figure 4-1
refer to figure 4-1. the movement from point a to point b on the graph is caused by
an increase in price.
a decrease in price.
a decrease in the price of a substitute good.
an increase in income.
Brief Explanations
- Analyze the demand curve movement: Point A to B is along the same demand curve.
- Check price and quantity: Price moves from \( P \) to \( P' \) (decrease), quantity from \( Q \) to \( Q' \) (increase).
- Recall demand law: Quantity demanded increases with price decrease (movement along demand curve, not shift).
- Evaluate options:
- "an increase in price": Contradicts (price decreases).
- "a decrease in price": Matches price drop and quantity rise (movement along demand curve).
- "a decrease in substitute price": Would shift demand curve, not movement along.
- "an increase in income": Would shift demand curve, not movement along.

Snap & solve any problem in the app
Get step-by-step solutions on Sovi AI
Photo-based solutions with guided steps
Explore more problems and detailed explanations
B. a decrease in price.