QUESTION IMAGE
Question
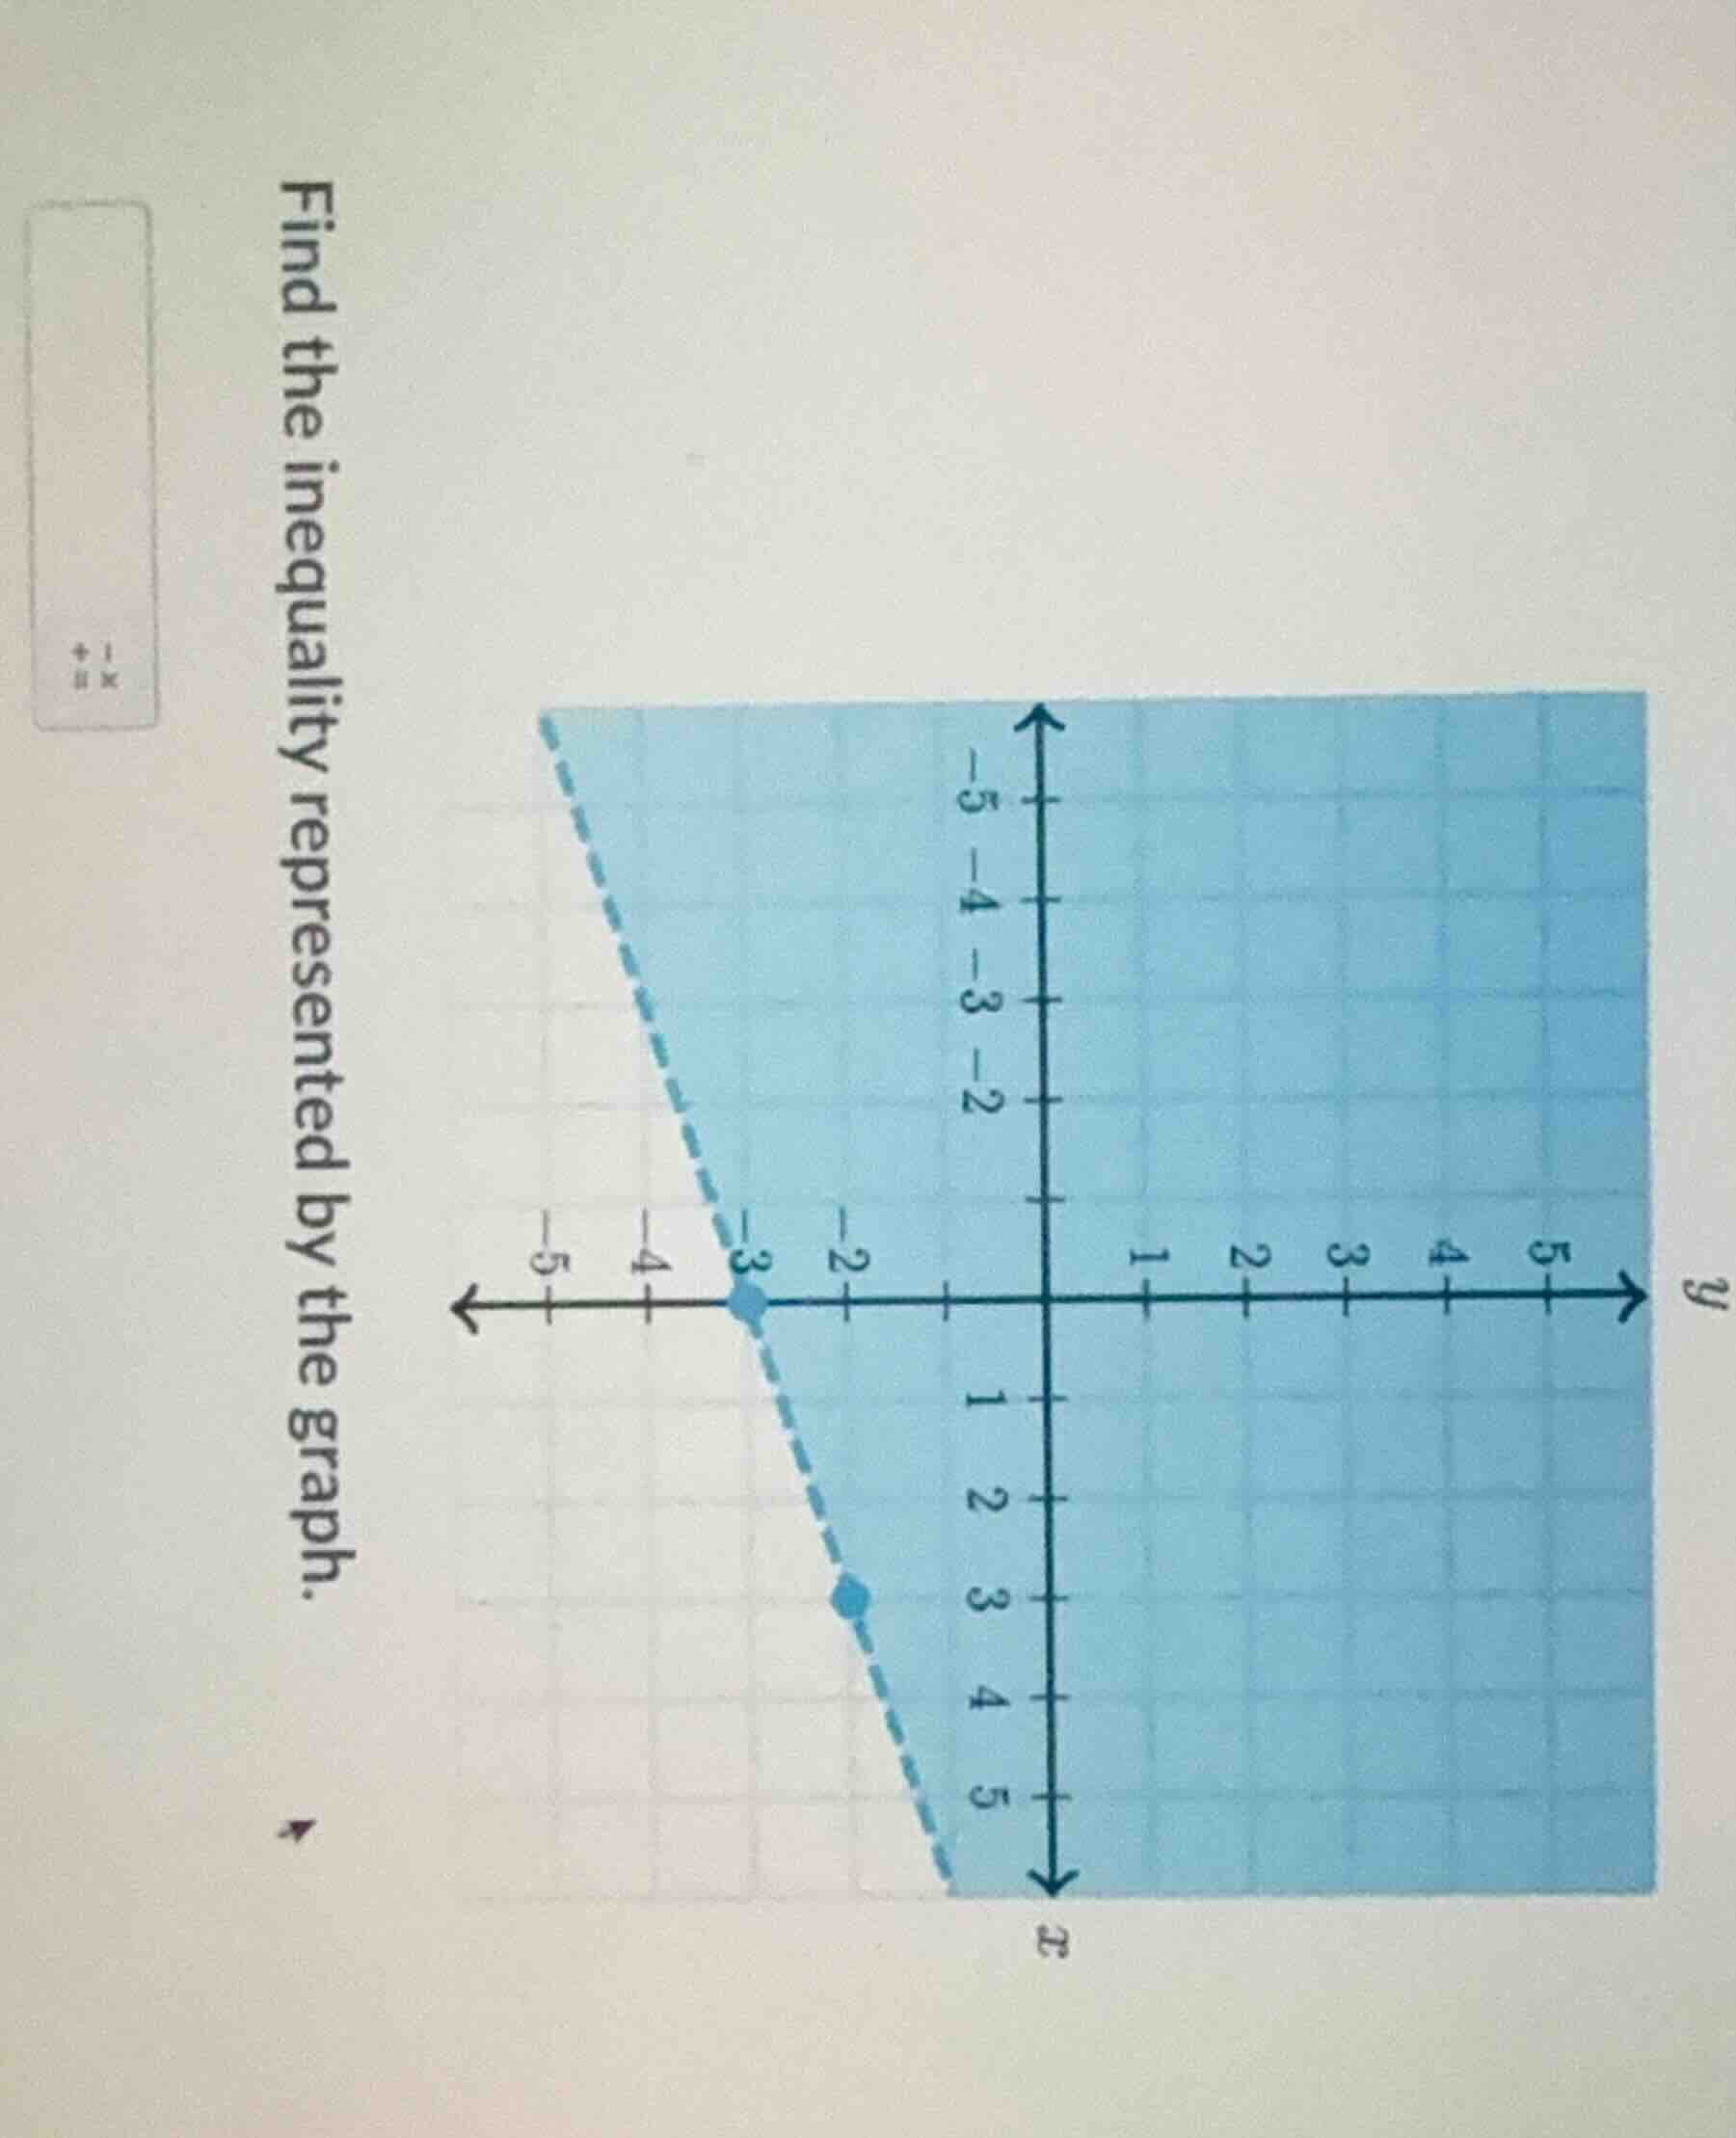
find the inequality represented by the graph.
Step1: Identify two points on the line
The two points on the dashed line are \((-3, 0)\) and \((3, -2)\) (assuming the second point is \((3, -2)\) from the graph).
Step2: Calculate the slope (\(m\))
The slope formula is \(m=\frac{y_2 - y_1}{x_2 - x_1}\). Substituting the points \((x_1,y_1)=(-3,0)\) and \((x_2,y_2)=(3,-2)\), we get \(m=\frac{-2 - 0}{3 - (-3)}=\frac{-2}{6}=-\frac{1}{3}\).
Step3: Find the equation of the line
Using the point - slope form \(y - y_1=m(x - x_1)\) with \((x_1,y_1)=(-3,0)\) and \(m =-\frac{1}{3}\), we have:
\(y-0=-\frac{1}{3}(x + 3)\)
\(y=-\frac{1}{3}x-1\)
Step4: Determine the inequality
Since the line is dashed, the inequality is either \(y>-\frac{1}{3}x - 1\) or \(y<-\frac{1}{3}x - 1\). We test a point in the shaded region, say \((0,0)\). Substituting into \(y\) and \(-\frac{1}{3}x - 1\), we get \(0\) and \(- 1\). Since \(0>-1\), the inequality is \(y>-\frac{1}{3}x - 1\).

Snap & solve any problem in the app
Get step-by-step solutions on Sovi AI
Photo-based solutions with guided steps
Explore more problems and detailed explanations
\(y>-\frac{1}{3}x - 1\)