QUESTION IMAGE
Question
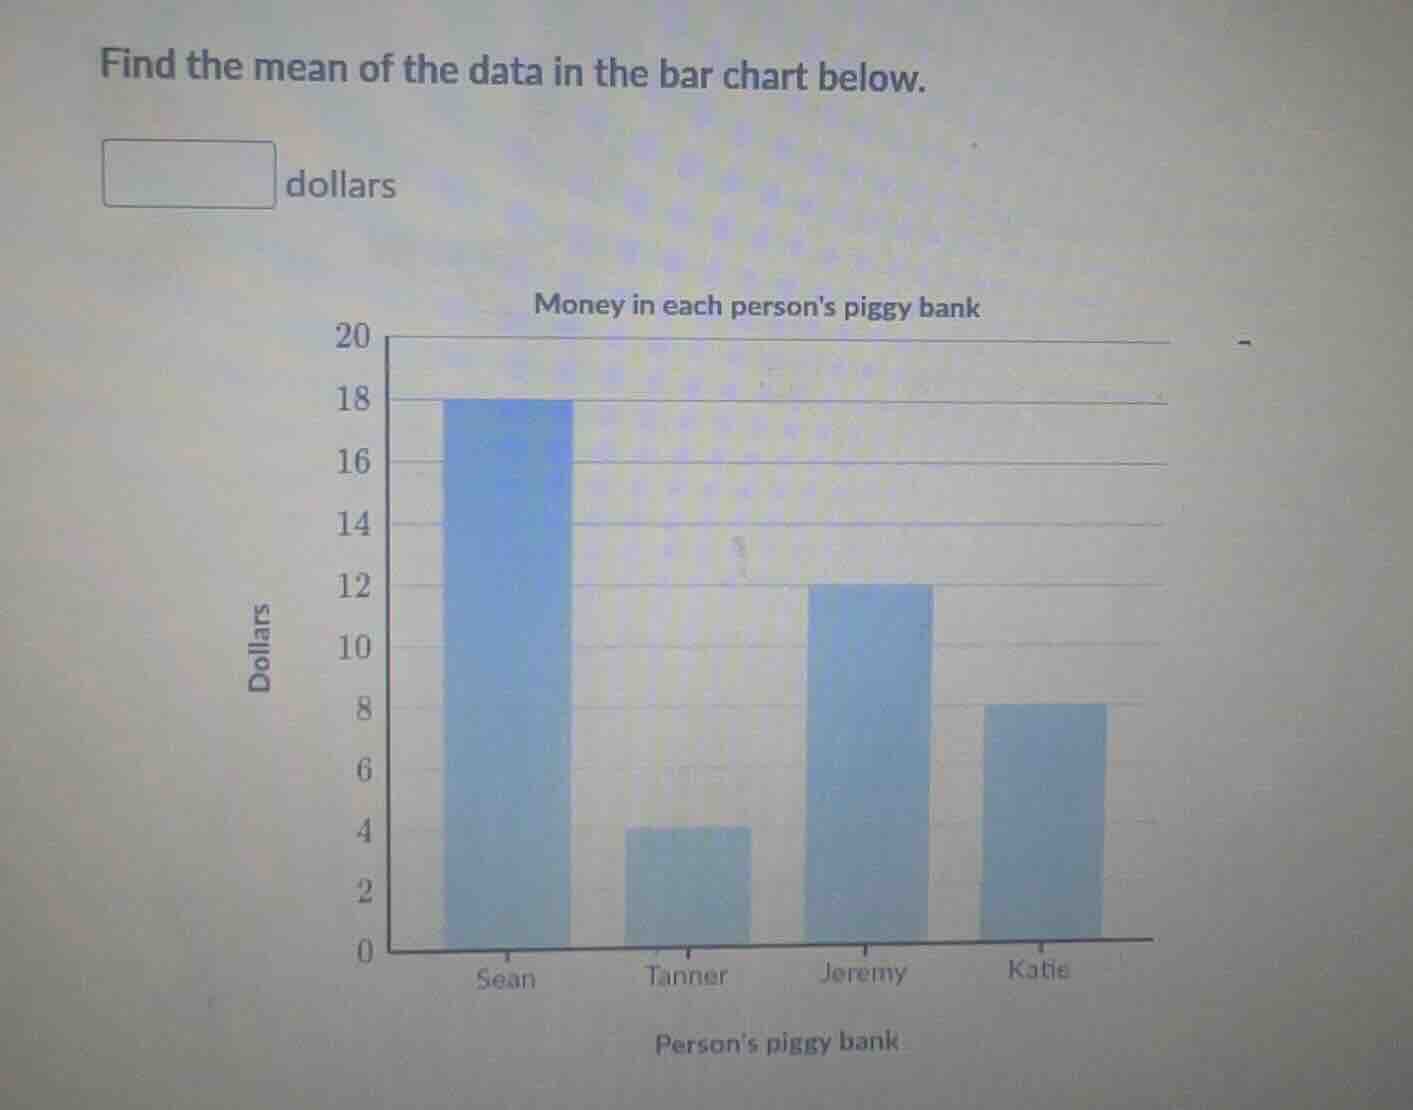
find the mean of the data in the bar chart below.
blank dollars
money in each persons piggy bank
(bar chart with sean: 18, tanner: 4, jeremy: 12, katie: 8)
Step1: Identify the data values
From the bar chart, the amounts of money (in dollars) are: Sean has 18, Tanner has 4, Jeremy has 12, and Katie has 8.
Step2: Calculate the sum of the data
The sum \( S \) is \( 18 + 4 + 12 + 8 \).
First, \( 18 + 4 = 22 \), then \( 22 + 12 = 34 \), and finally \( 34 + 8 = 42 \).
Step3: Determine the number of data points
There are 4 people, so the number of data points \( n = 4 \).
Step4: Calculate the mean
The mean \( \bar{x} \) is given by the formula \( \bar{x}=\frac{S}{n} \).
Substituting \( S = 42 \) and \( n = 4 \), we get \( \bar{x}=\frac{42}{4}=10.5 \).

Snap & solve any problem in the app
Get step-by-step solutions on Sovi AI
Photo-based solutions with guided steps
Explore more problems and detailed explanations
10.5