QUESTION IMAGE
Question
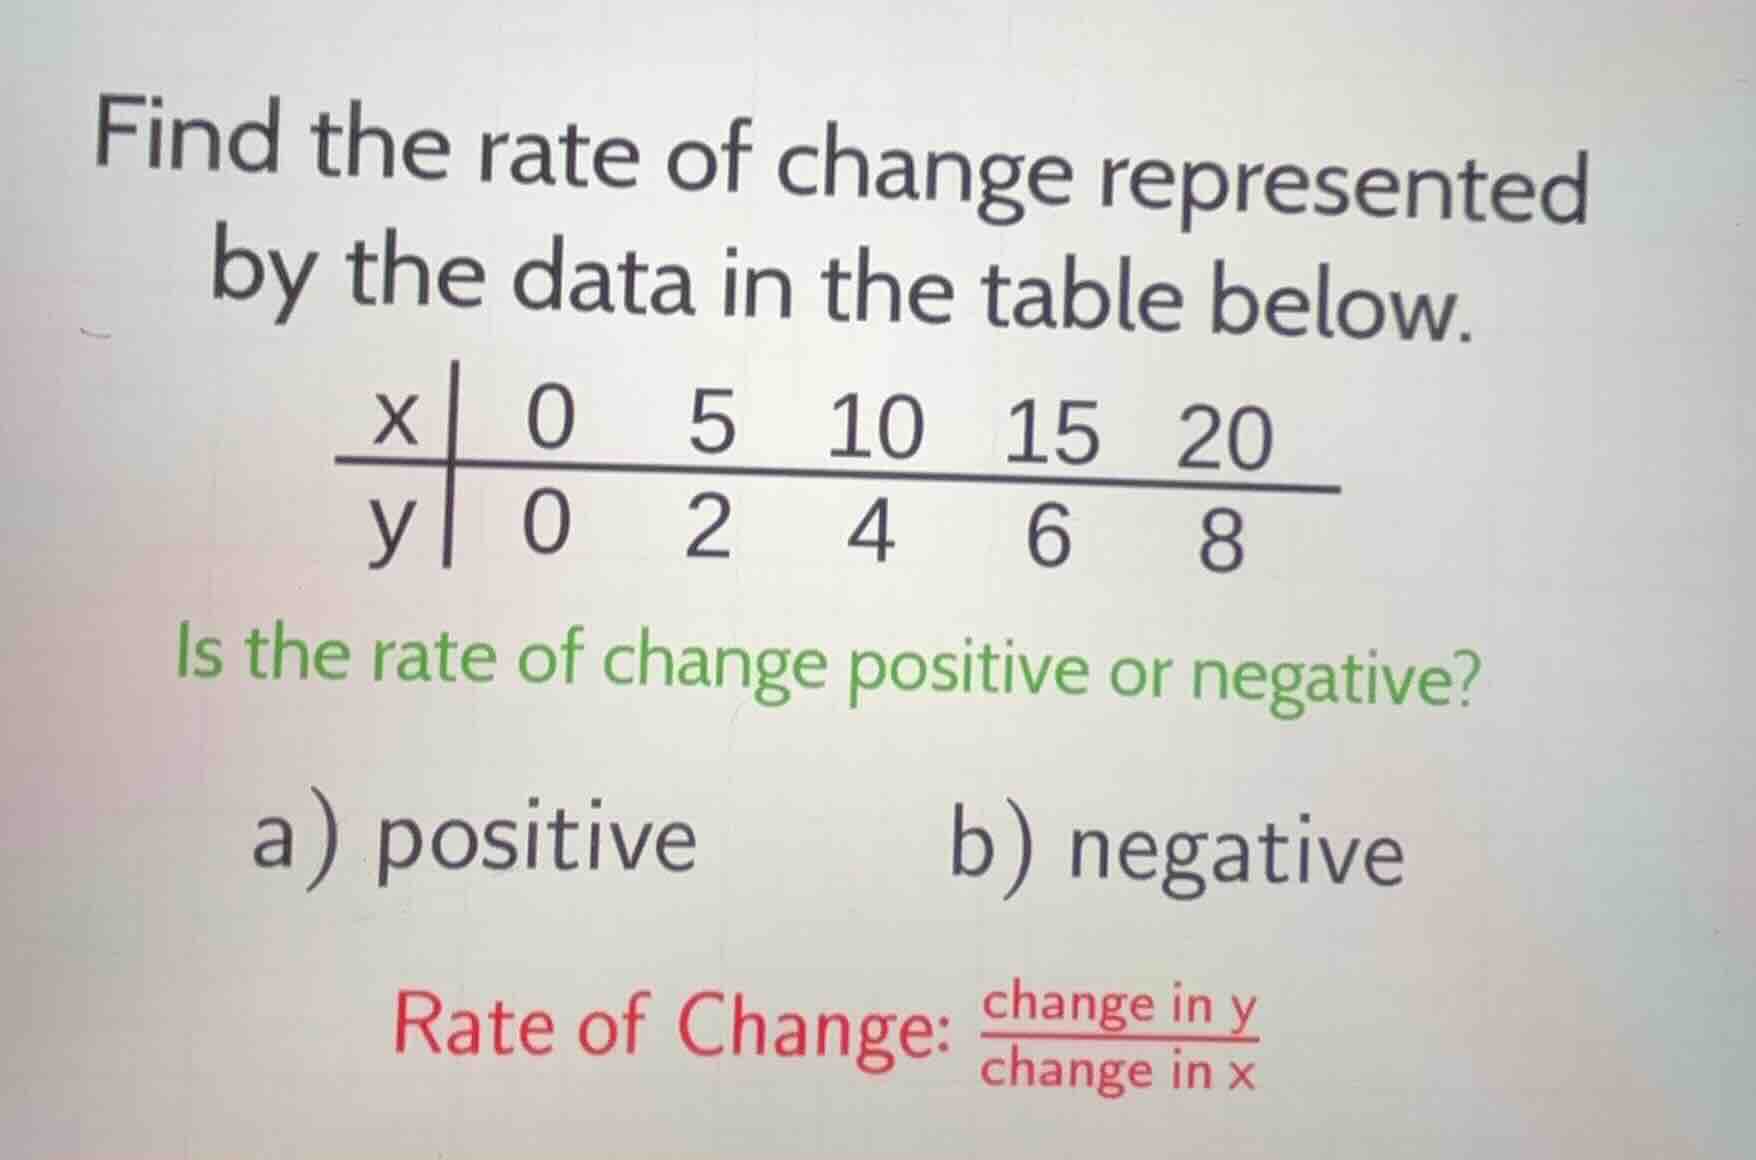
find the rate of change represented by the data in the table below.
\
$$\begin{array}{c|ccccc}x&0&5&10&15&20\\hline y&0&2&4&6&8\\end{array}$$
is the rate of change positive or negative?
a) positive \t\t b) negative
rate of change: \frac{\text{change in } y}{\text{change in } x}
Step1: Calculate change in y
$\Delta y = 2 - 0 = 2$
Step2: Calculate change in x
$\Delta x = 5 - 0 = 5$
Step3: Compute rate of change
$\text{Rate of Change} = \frac{\Delta y}{\Delta x} = \frac{2}{5} = 0.4$
Step4: Determine sign of rate
The value $0.4$ is greater than 0, so it is positive.

Snap & solve any problem in the app
Get step-by-step solutions on Sovi AI
Photo-based solutions with guided steps
Explore more problems and detailed explanations
Rate of Change: $\frac{2}{5}$ (or 0.4)
a) positive