QUESTION IMAGE
Question
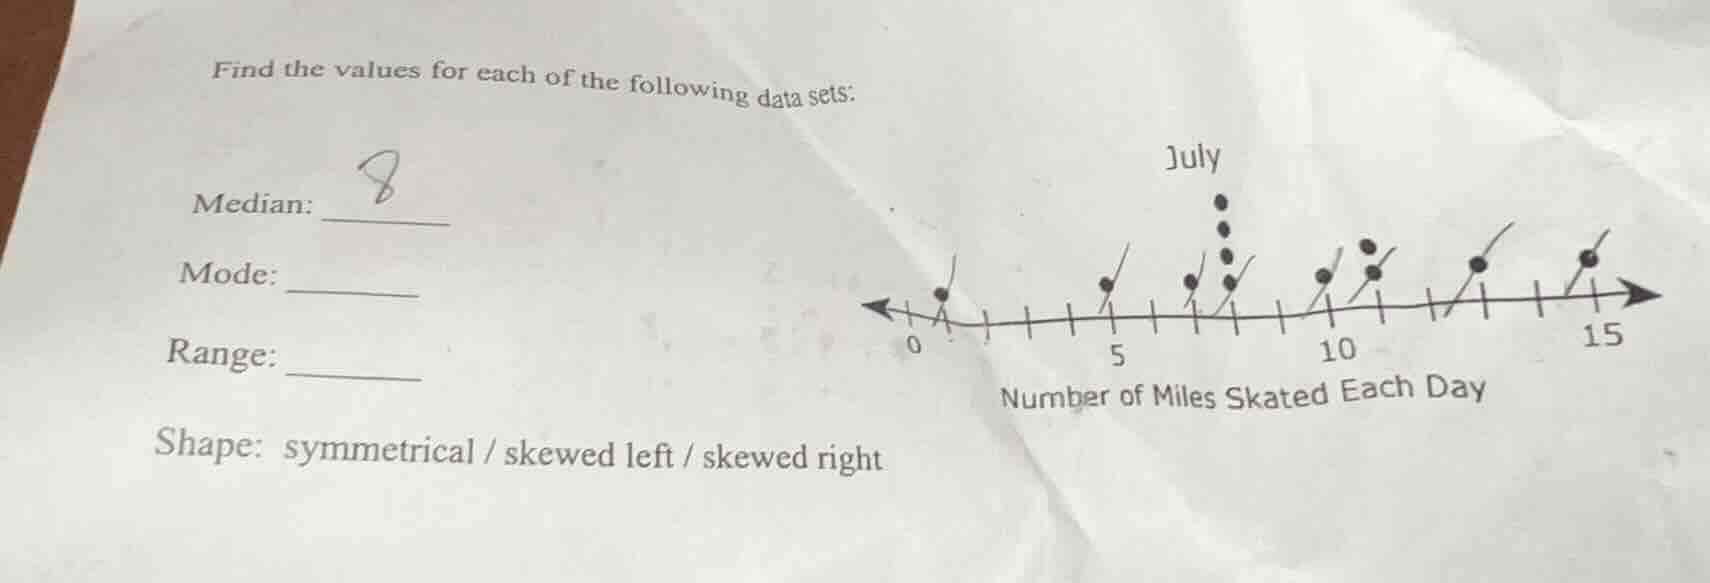
find the values for each of the following data sets:
median:
mode:
range:
shape: symmetrical / skewed left / skewed right
(there is a dot plot on the right with the title july and the x - axis label number of miles skated each day, with marks at 0, 5, 10, 15 and some dots above the number line)
Step1: List all data points
From the dot plot, the data set is: $1, 5, 7, 8, 8, 8, 8, 10, 11, 11, 13, 15$
Step2: Calculate the median
There are 12 data points. The median is the average of the 6th and 7th values.
$\text{Median} = \frac{8 + 8}{2} = 8$
Step3: Identify the mode
The mode is the most frequent value, which appears 4 times.
Mode = 8
Step4: Calculate the range
Range is the difference between maximum and minimum values.
$\text{Range} = 15 - 1 = 14$
Step5: Determine the shape
Most data clusters on the left, with fewer values on the right tail. This means the distribution is skewed right.

Snap & solve any problem in the app
Get step-by-step solutions on Sovi AI
Photo-based solutions with guided steps
Explore more problems and detailed explanations
Median: 8
Mode: 8
Range: 14
Shape: skewed right