QUESTION IMAGE
Question
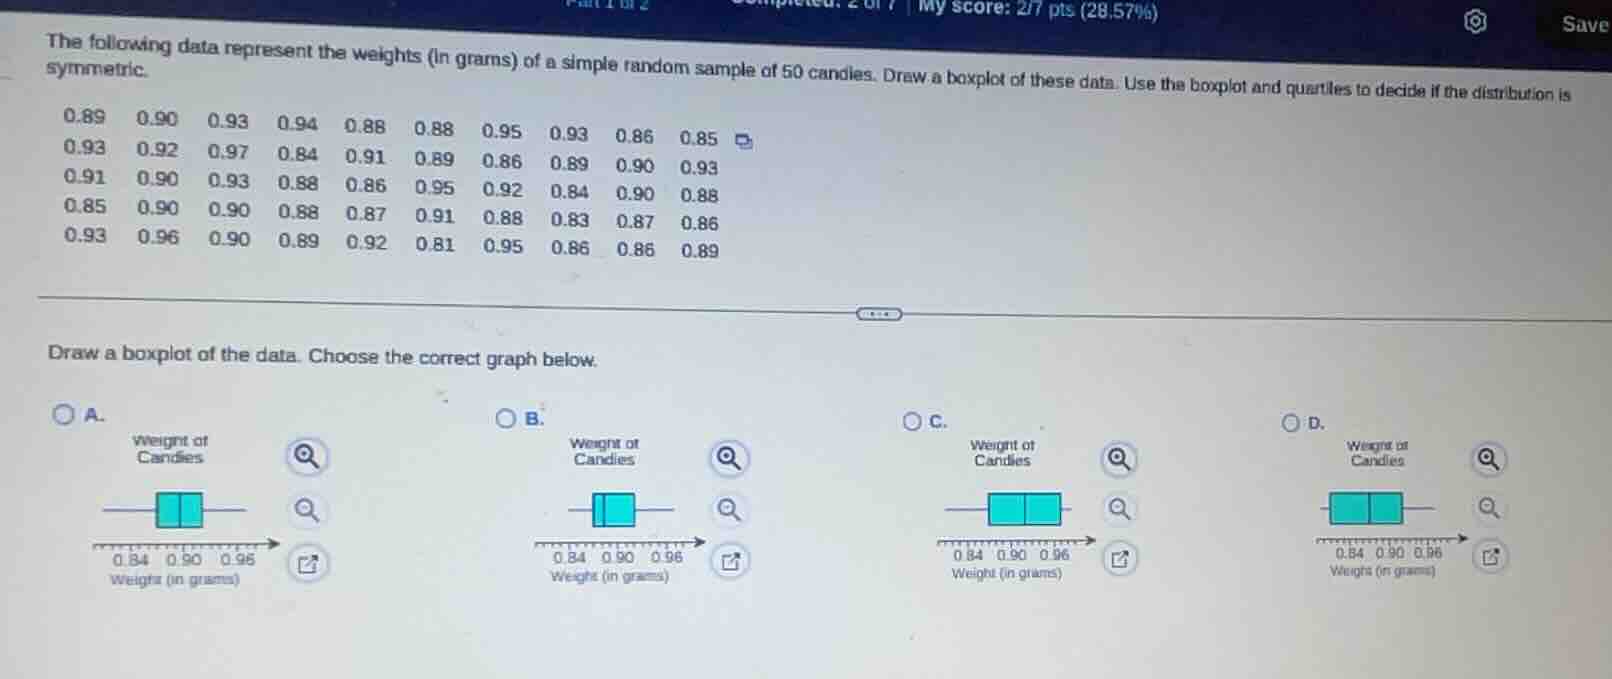
the following data represent the weights (in grams) of a simple random sample of 50 candles. draw a boxplot of these data. use the boxplot and quartiles to decide if the distribution is symmetric.0.89 0.90 0.93 0.94 0.88 0.88 0.95 0.93 0.86 0.850.93 0.92 0.97 0.84 0.91 0.89 0.86 0.89 0.90 0.930.91 0.90 0.93 0.88 0.86 0.95 0.92 0.84 0.90 0.880.85 0.90 0.90 0.88 0.87 0.91 0.88 0.83 0.87 0.860.93 0.96 0.90 0.89 0.92 0.81 0.95 0.86 0.86 0.89draw a boxplot of the data. choose the correct graph below.a.weight of candles0.84 0.90 0.96weights (in grams)b.weight of candles0.84 0.90 0.96weights (in grams)c.weight of candles0.84 0.90 0.96weights (in grams)d.weight of candles0.84 0.90 0.96weights (in grams)
Step1: Sort the data set
First, arrange all 50 weights in ascending order:
0.81, 0.83, 0.84, 0.84, 0.85, 0.85, 0.86, 0.86, 0.86, 0.86, 0.86, 0.87, 0.87, 0.88, 0.88, 0.88, 0.88, 0.88, 0.89, 0.89, 0.89, 0.89, 0.90, 0.90, 0.90, 0.90, 0.90, 0.90, 0.91, 0.91, 0.91, 0.92, 0.92, 0.92, 0.93, 0.93, 0.93, 0.93, 0.93, 0.93, 0.94, 0.95, 0.95, 0.95, 0.96, 0.97
Step2: Find minimum and maximum
Minimum = $0.81$, Maximum = $0.97$
Step3: Calculate median (Q2)
For $n=50$, median is average of 25th and 26th values:
$\text{Q2} = \frac{0.90 + 0.90}{2} = 0.90$
Step4: Calculate Q1 (lower quartile)
Q1 is median of first 25 values (1st to 25th):
13th value = $0.87$, so $\text{Q1} = 0.87$
Step5: Calculate Q3 (upper quartile)
Q3 is median of last 25 values (26th to 50th):
38th value = $0.93$, so $\text{Q3} = 0.93$
Step6: Check boxplot alignment
The interquartile range $\text{IQR} = 0.93 - 0.87 = 0.06$. The distance from Q1 to median is $0.90 - 0.87 = 0.03$, and from median to Q3 is $0.93 - 0.90 = 0.03$. These are equal, so the box is symmetric around the median. The left whisker extends to 0.81, right whisker to 0.97, matching option A.

Snap & solve any problem in the app
Get step-by-step solutions on Sovi AI
Photo-based solutions with guided steps
Explore more problems and detailed explanations
A. Weight of Candies (boxplot with symmetric box, left whisker to 0.81, right whisker to 0.97, box spanning 0.87 to 0.93, median at 0.90)
The distribution is symmetric, as the distances from the median to Q1 and Q3 are equal, and the whiskers are roughly balanced relative to the box.