QUESTION IMAGE
Question
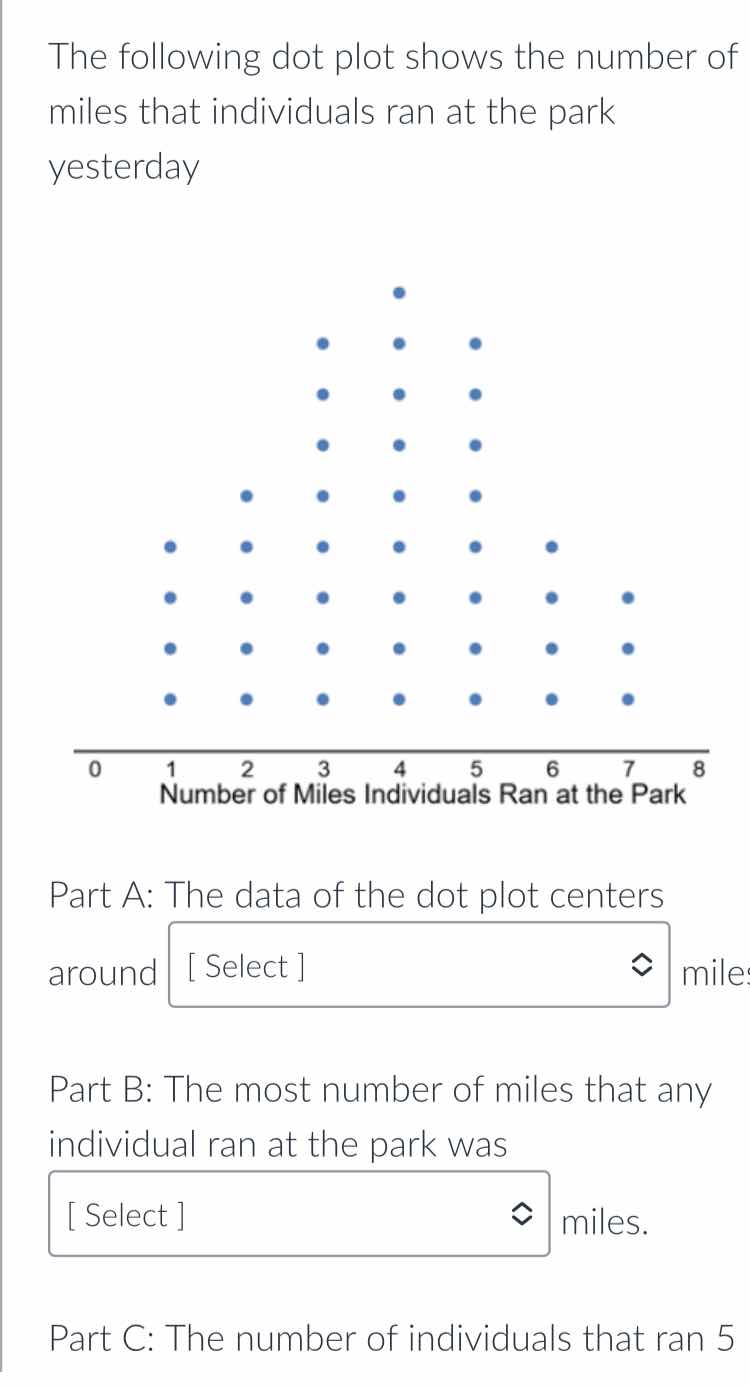
the following dot plot shows the number of miles that individuals ran at the park yesterday
part a: the data of the dot plot centers around select miles
part b: the most number of miles that any individual ran at the park was select miles.
part c: the number of individuals that ran 5
Step1: Count dots per mile value
Count dots for each mile:
- 1 mile: 4 dots
- 2 miles: 5 dots
- 3 miles: 6 dots
- 4 miles: 7 dots
- 5 miles: 6 dots
- 6 miles: 4 dots
- 7 miles: 3 dots
Step2: Find center of the data
The center is the value with the highest frequency, or the middle of the symmetric distribution. The data is symmetric around 4 miles, which has the highest count.
Step3: Find maximum miles run
Identify the rightmost value with dots: 7 miles.
Step4: Count dots for 5 miles
Count the dots above 5 on the axis: 6 dots.

Snap & solve any problem in the app
Get step-by-step solutions on Sovi AI
Photo-based solutions with guided steps
Explore more problems and detailed explanations
Part A: 4
Part B: 7
Part C: 6