QUESTION IMAGE
Question
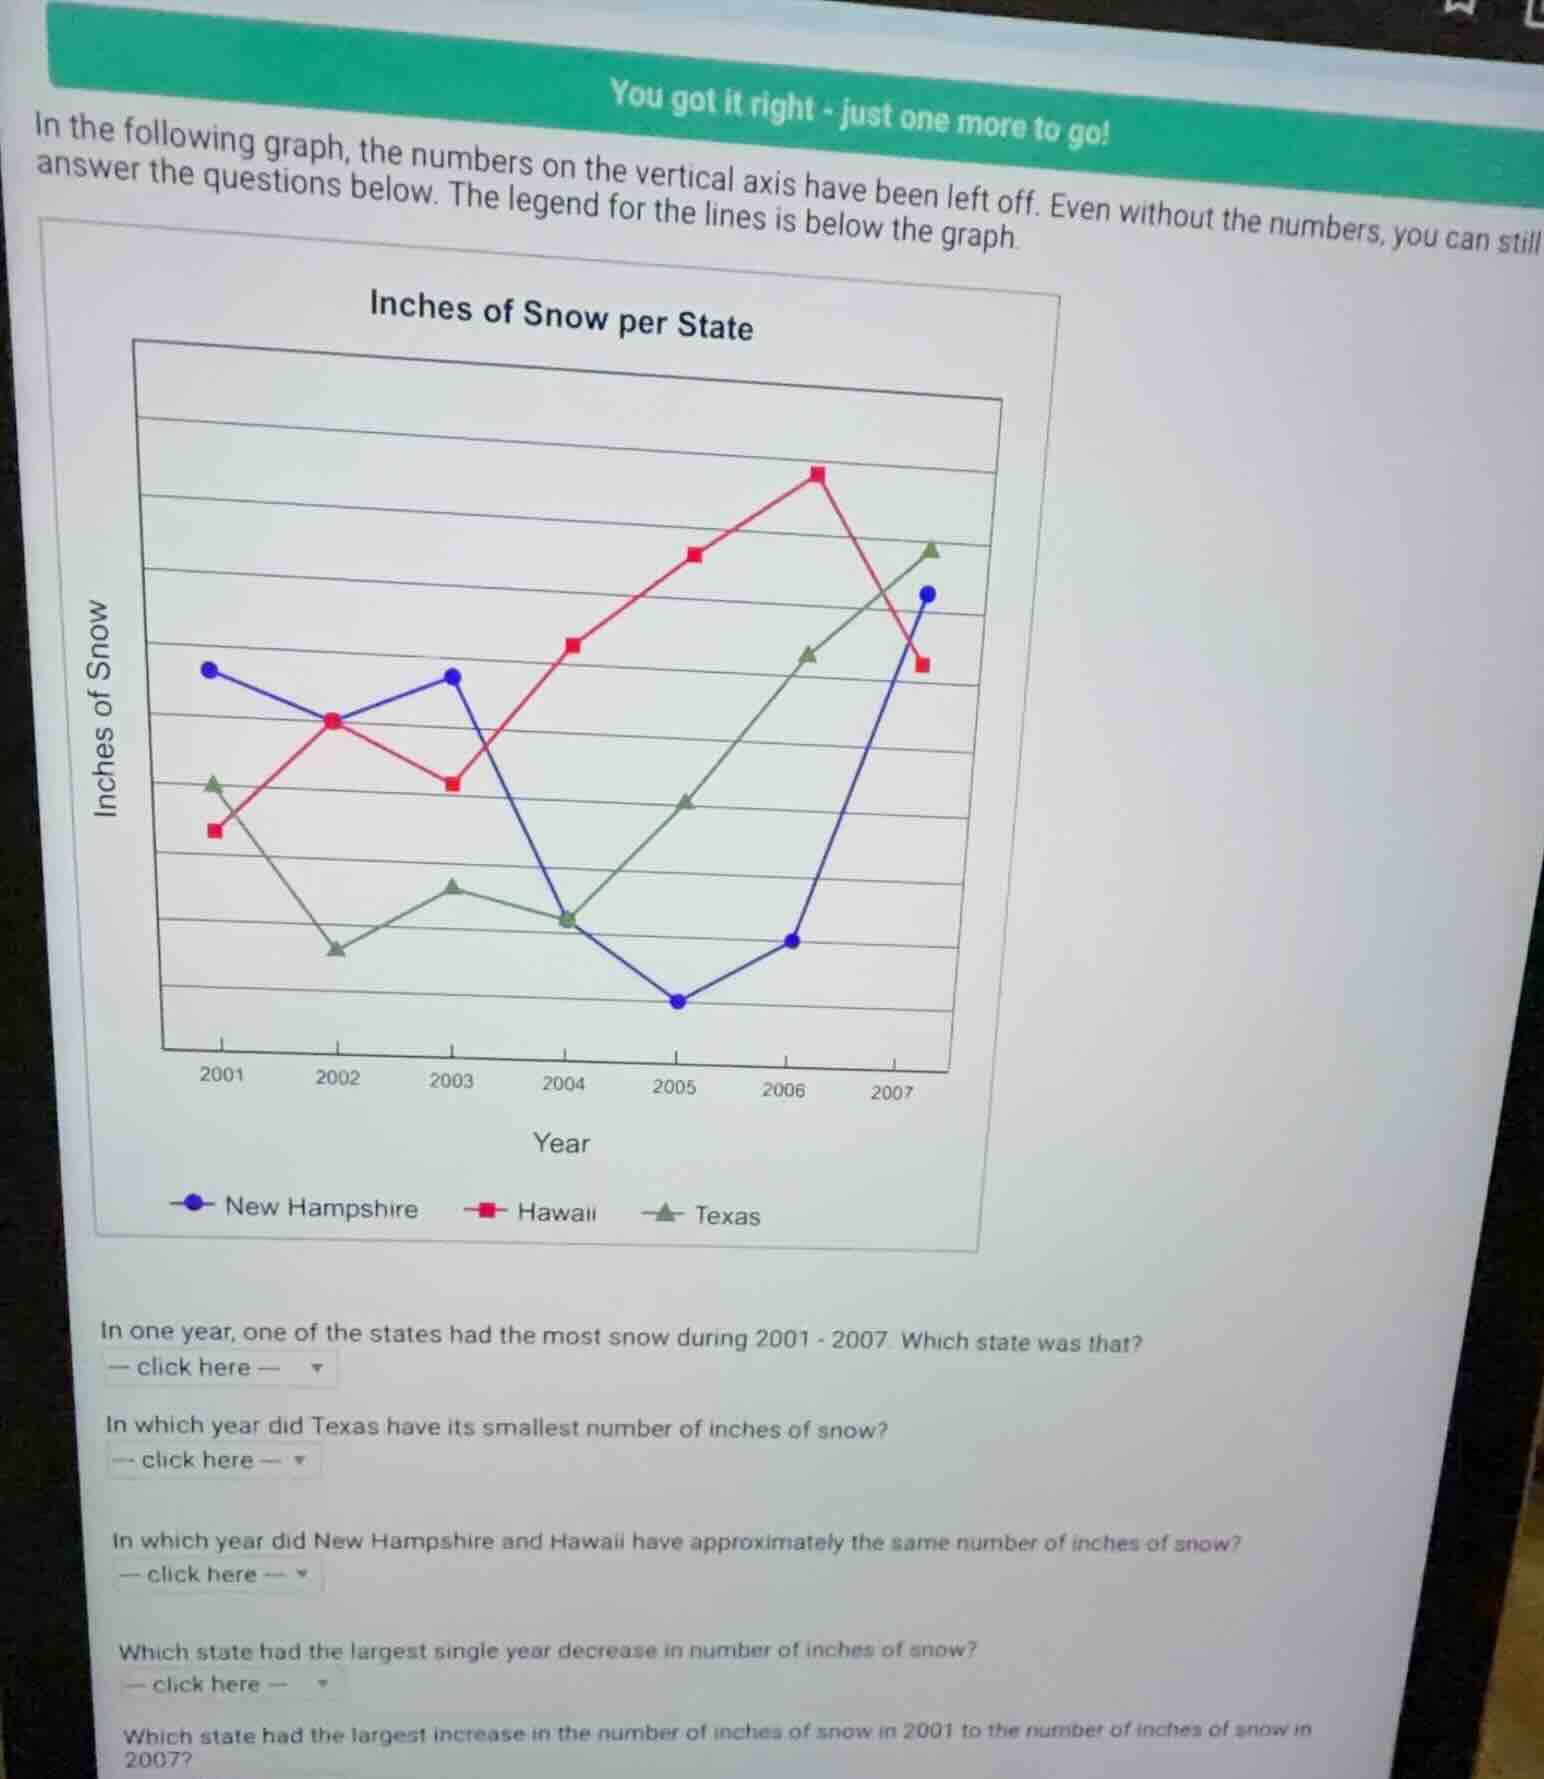
in the following graph, the numbers on the vertical axis have been left off. even without the numbers, you can still answer the questions below. the legend for the lines is below the graph.
inches of snow per state
(graph with x - axis as year (2001 - 2007), y - axis as inches of snow, and lines for new hampshire (blue), hawaii (red), texas (green))
legend:
- new hampshire (blue dot)
- hawaii (red square)
- texas (green triangle)
questions:
- in one year, one of the states had the most snow during 2001 - 2007. which state was that?
- in which year did texas have its smallest number of inches of snow?
- in which year did new hampshire and hawaii have approximately the same number of inches of snow?
- which state had the largest single year decrease in number of inches of snow?
- which state had the largest increase in the number of inches of snow from 2001 to 2007?
Brief Explanations
- For the first question, identify the highest single data point across all lines and match it to its state.
- For the second question, find the lowest data point on the Texas line and note its corresponding year.
- For the third question, locate the year where the New Hampshire and Hawaii lines intersect (their points are at the same vertical level).
- For the fourth question, calculate the vertical drop between consecutive years for each state, and identify the largest drop.
- For the fifth question, compare the vertical difference between 2001 and 2007 for each state, and identify the largest positive change.

Snap & solve any problem in the app
Get step-by-step solutions on Sovi AI
Photo-based solutions with guided steps
Explore more problems and detailed explanations
- Hawaii
- 2002
- 2002
- New Hampshire
- Texas