QUESTION IMAGE
Question
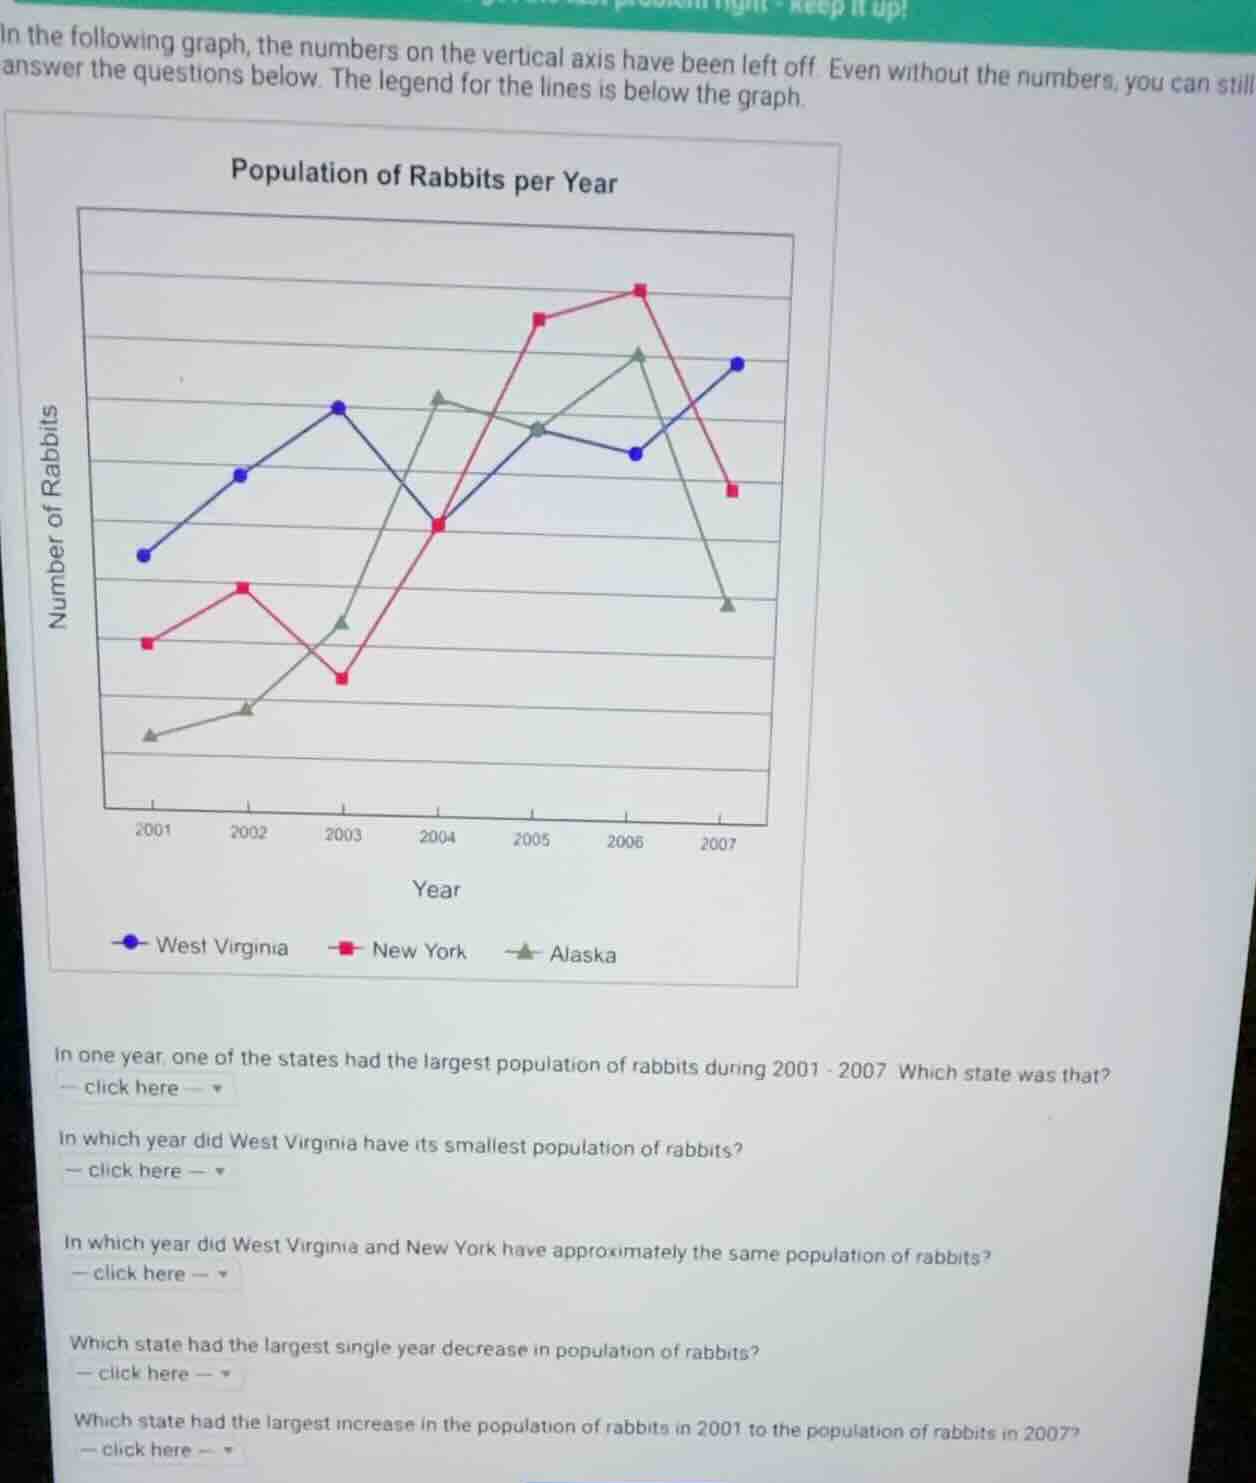
in the following graph, the numbers on the vertical axis have been left off. even without the numbers, you can still answer the questions below. the legend for the lines is below the graph.
population of rabbits per year
(graph showing number of rabbits over years 2001 - 2007 for west virginia (blue), new york (red), alaska (gray))
in one year, one of the states had the largest population of rabbits during 2001 - 2007. which state was that?
— click here —
in which year did west virginia have its smallest population of rabbits?
— click here —
in which year did west virginia and new york have approximately the same population of rabbits?
— click here —
which state had the largest single year decrease in population of rabbits?
— click here —
which state had the largest increase in the population of rabbits in 2001 to the population of rabbits in 2007?
— click here —
- For the largest population: Look for the highest single data point across all lines; New York's 2006 point is the highest.
- For West Virginia's smallest population: Find the lowest point on the West Virginia line, which is in 2001.
- For matching populations: Identify the year where West Virginia and New York lines intersect, which is 2004.
- For largest single-year decrease: Compare the steepest downward slopes; Alaska's drop from 2006 to 2007 is the most drastic.
- For largest total increase (2001-2007): Compare each state's 2001 and 2007 values. Alaska's 2007 value is far higher than its 2001 value, a bigger change than the other states.

Snap & solve any problem in the app
Get step-by-step solutions on Sovi AI
Photo-based solutions with guided steps
Explore more problems and detailed explanations
- New York
- 2001
- 2004
- Alaska
- Alaska