QUESTION IMAGE
Question
football
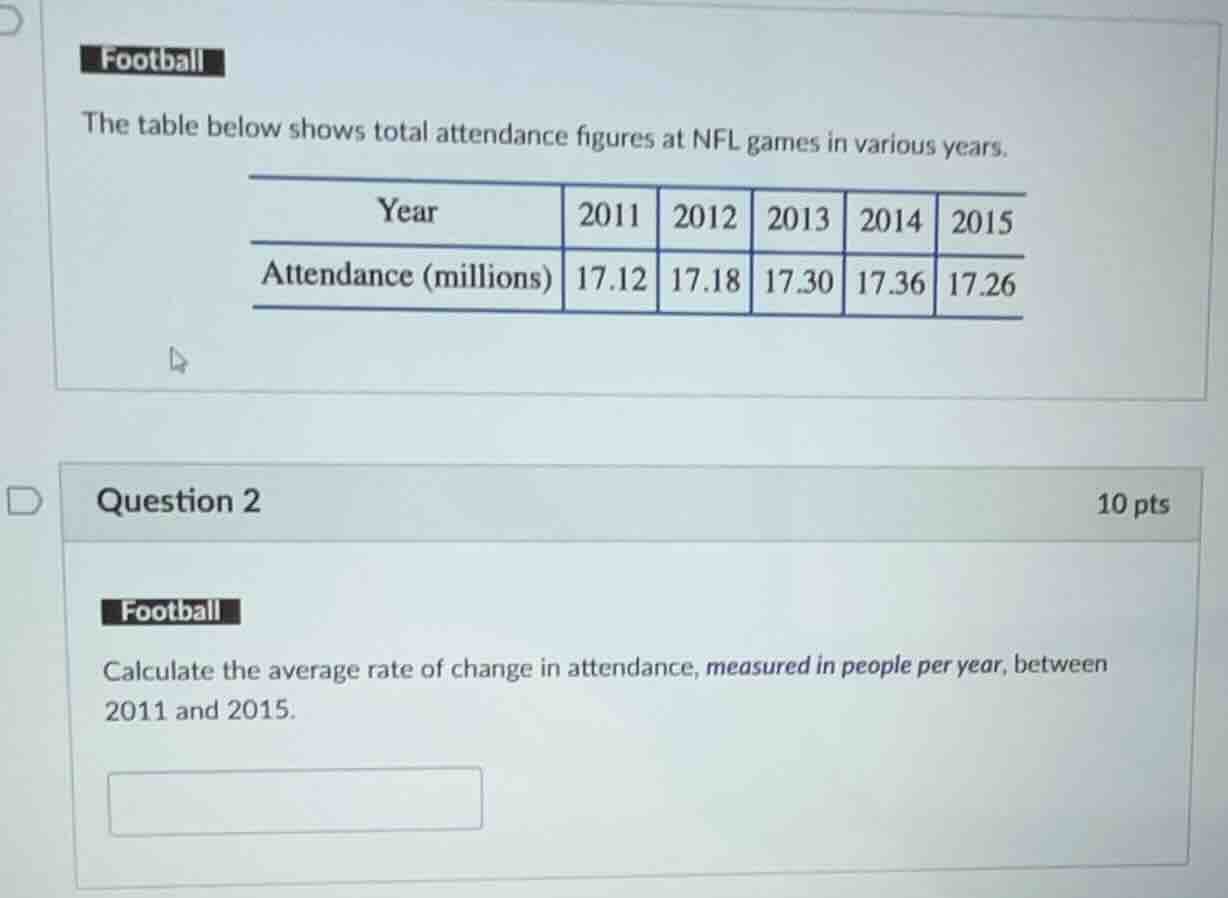
the table below shows total attendance figures at nfl games in various years.
| year | 2011 | 2012 | 2013 | 2014 | 2015 |
|---|
question 2
10 pts
football
calculate the average rate of change in attendance, measured in people per year, between 2011 and 2015.
Step1: Identify the formula for average rate of change
The formula for average rate of change between two points \((x_1, y_1)\) and \((x_2, y_2)\) is \(\frac{y_2 - y_1}{x_2 - x_1}\). Here, \(x\) represents the year and \(y\) represents the attendance (in millions).
Step2: Determine the values of \(x_1\), \(y_1\), \(x_2\), \(y_2\)
For 2011: \(x_1 = 2011\), \(y_1 = 17.12\) (in millions)
For 2015: \(x_2 = 2015\), \(y_2 = 17.26\) (in millions)
Step3: Calculate the change in attendance and change in years
Change in attendance (\(\Delta y\)): \(y_2 - y_1 = 17.26 - 17.12 = 0.14\) (in millions)
Change in years (\(\Delta x\)): \(x_2 - x_1 = 2015 - 2011 = 4\) years
Step4: Calculate the average rate of change
Average rate of change = \(\frac{\Delta y}{\Delta x}=\frac{0.14}{4}= 0.035\) (in millions per year)
To convert this to people per year, since 1 million = \(10^6\) people, we multiply by \(10^6\):
\(0.035\times10^6 = 35000\) people per year

Snap & solve any problem in the app
Get step-by-step solutions on Sovi AI
Photo-based solutions with guided steps
Explore more problems and detailed explanations
35000