QUESTION IMAGE
Question
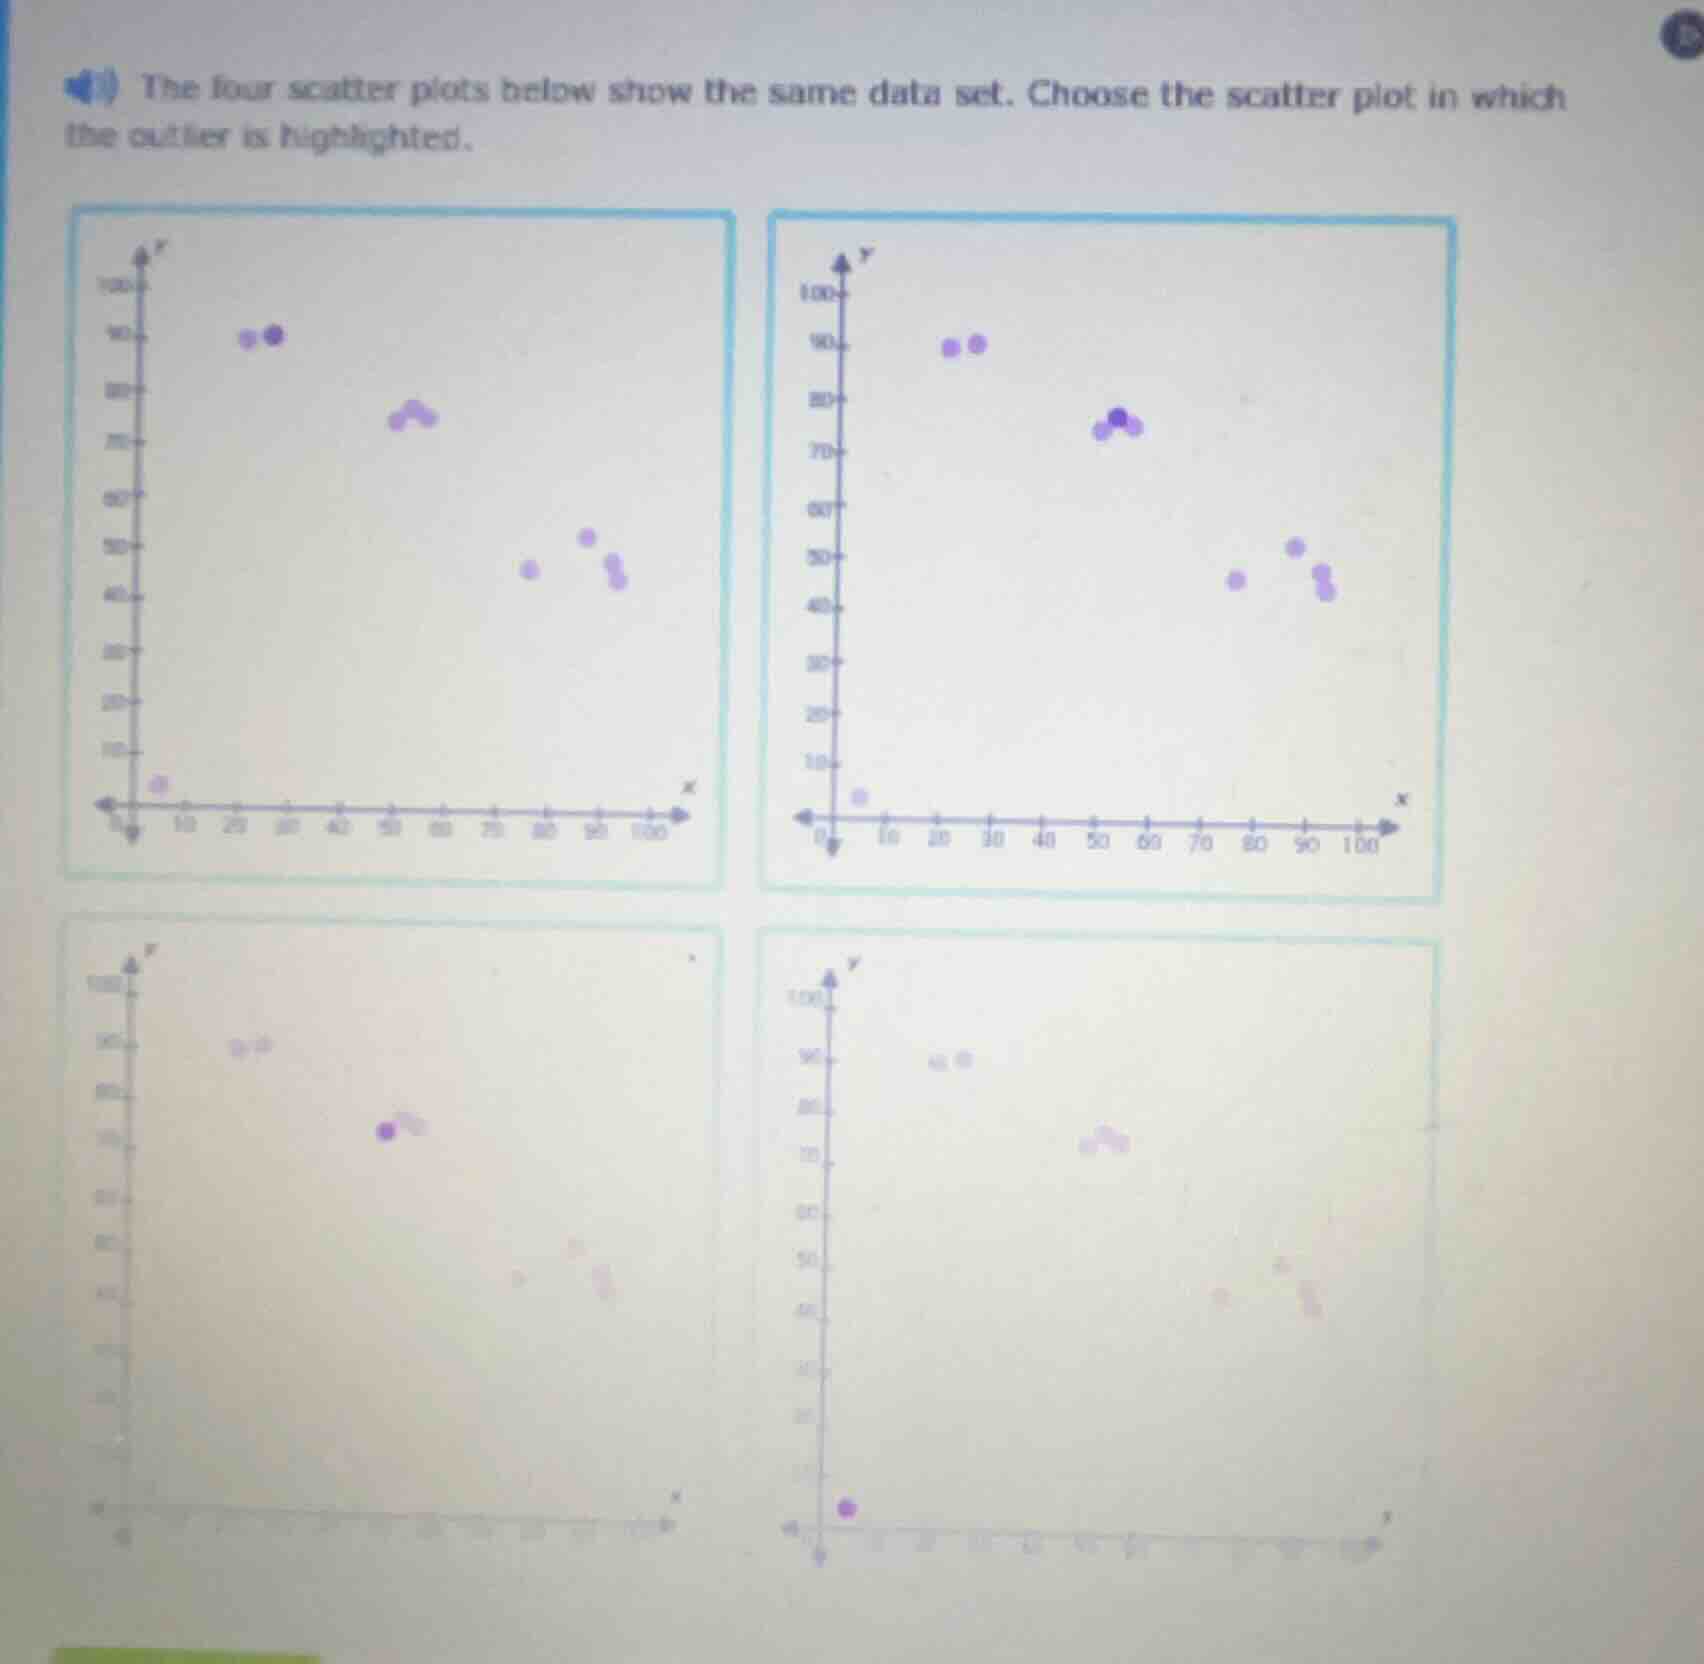
the four scatter plots below show the same data set. choose the scatter plot in which the outlier is highlighted.
Brief Explanations
An outlier is a data point that lies far outside the cluster of the majority of data points. In this dataset, the point at (0, ~0) is the outlier, as all other points cluster in the upper-right region of the plot. The bottom-right scatter plot correctly highlights this distant point as the outlier.

Snap & solve any problem in the app
Get step-by-step solutions on Sovi AI
Photo-based solutions with guided steps
Explore more problems and detailed explanations
The bottom-right scatter plot (with the highlighted point near the origin (0,0))