QUESTION IMAGE
Question
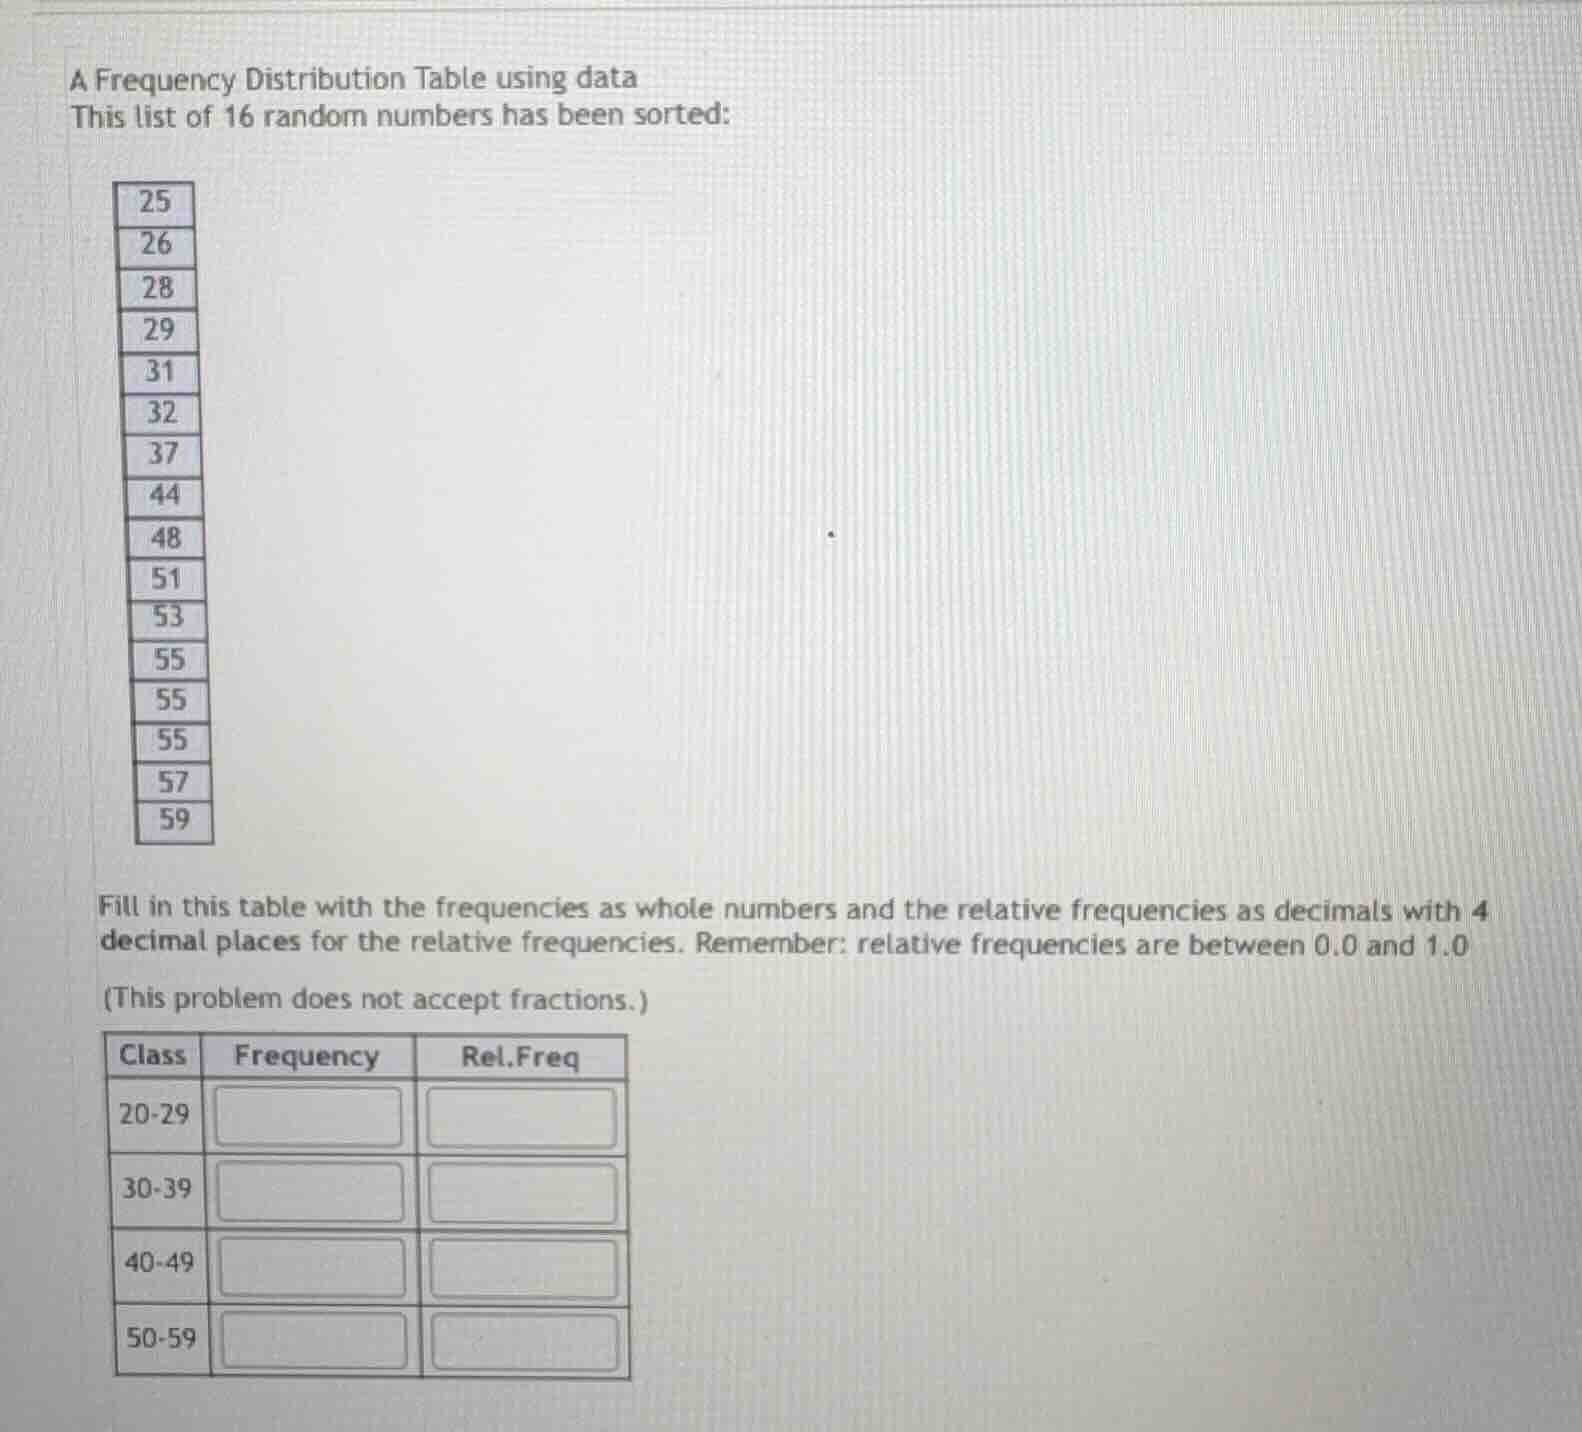
a frequency distribution table using data
this list of 16 random numbers has been sorted:
25
26
28
29
31
32
37
44
48
51
53
55
55
55
57
59
fill in this table with the frequencies as whole numbers and the relative frequencies as decimals with 4 decimal places for the relative frequencies. remember: relative frequencies are between 0.0 and 1.0
(this problem does not accept fractions.)
class frequency rel.freq
20 - 29
30 - 39
40 - 49
50 - 59
Step1: Count 20-29 values
Numbers: 25,26,28,29 → Frequency = 4
Relative Frequency: $\frac{4}{16} = 0.2500$
Step2: Count 30-39 values
Numbers: 31,32,37 → Frequency = 3
Relative Frequency: $\frac{3}{16} = 0.1875$
Step3: Count 40-49 values
Numbers: 44,48 → Frequency = 2
Relative Frequency: $\frac{2}{16} = 0.1250$
Step4: Count 50-59 values
Numbers: 51,53,55,55,55,57,59 → Frequency = 7
Relative Frequency: $\frac{7}{16} = 0.4375$

Snap & solve any problem in the app
Get step-by-step solutions on Sovi AI
Photo-based solutions with guided steps
Explore more problems and detailed explanations
| Class | Frequency | Rel.Freq |
|---|---|---|
| 30-39 | 3 | 0.1875 |
| 40-49 | 2 | 0.1250 |
| 50-59 | 7 | 0.4375 |