QUESTION IMAGE
Question
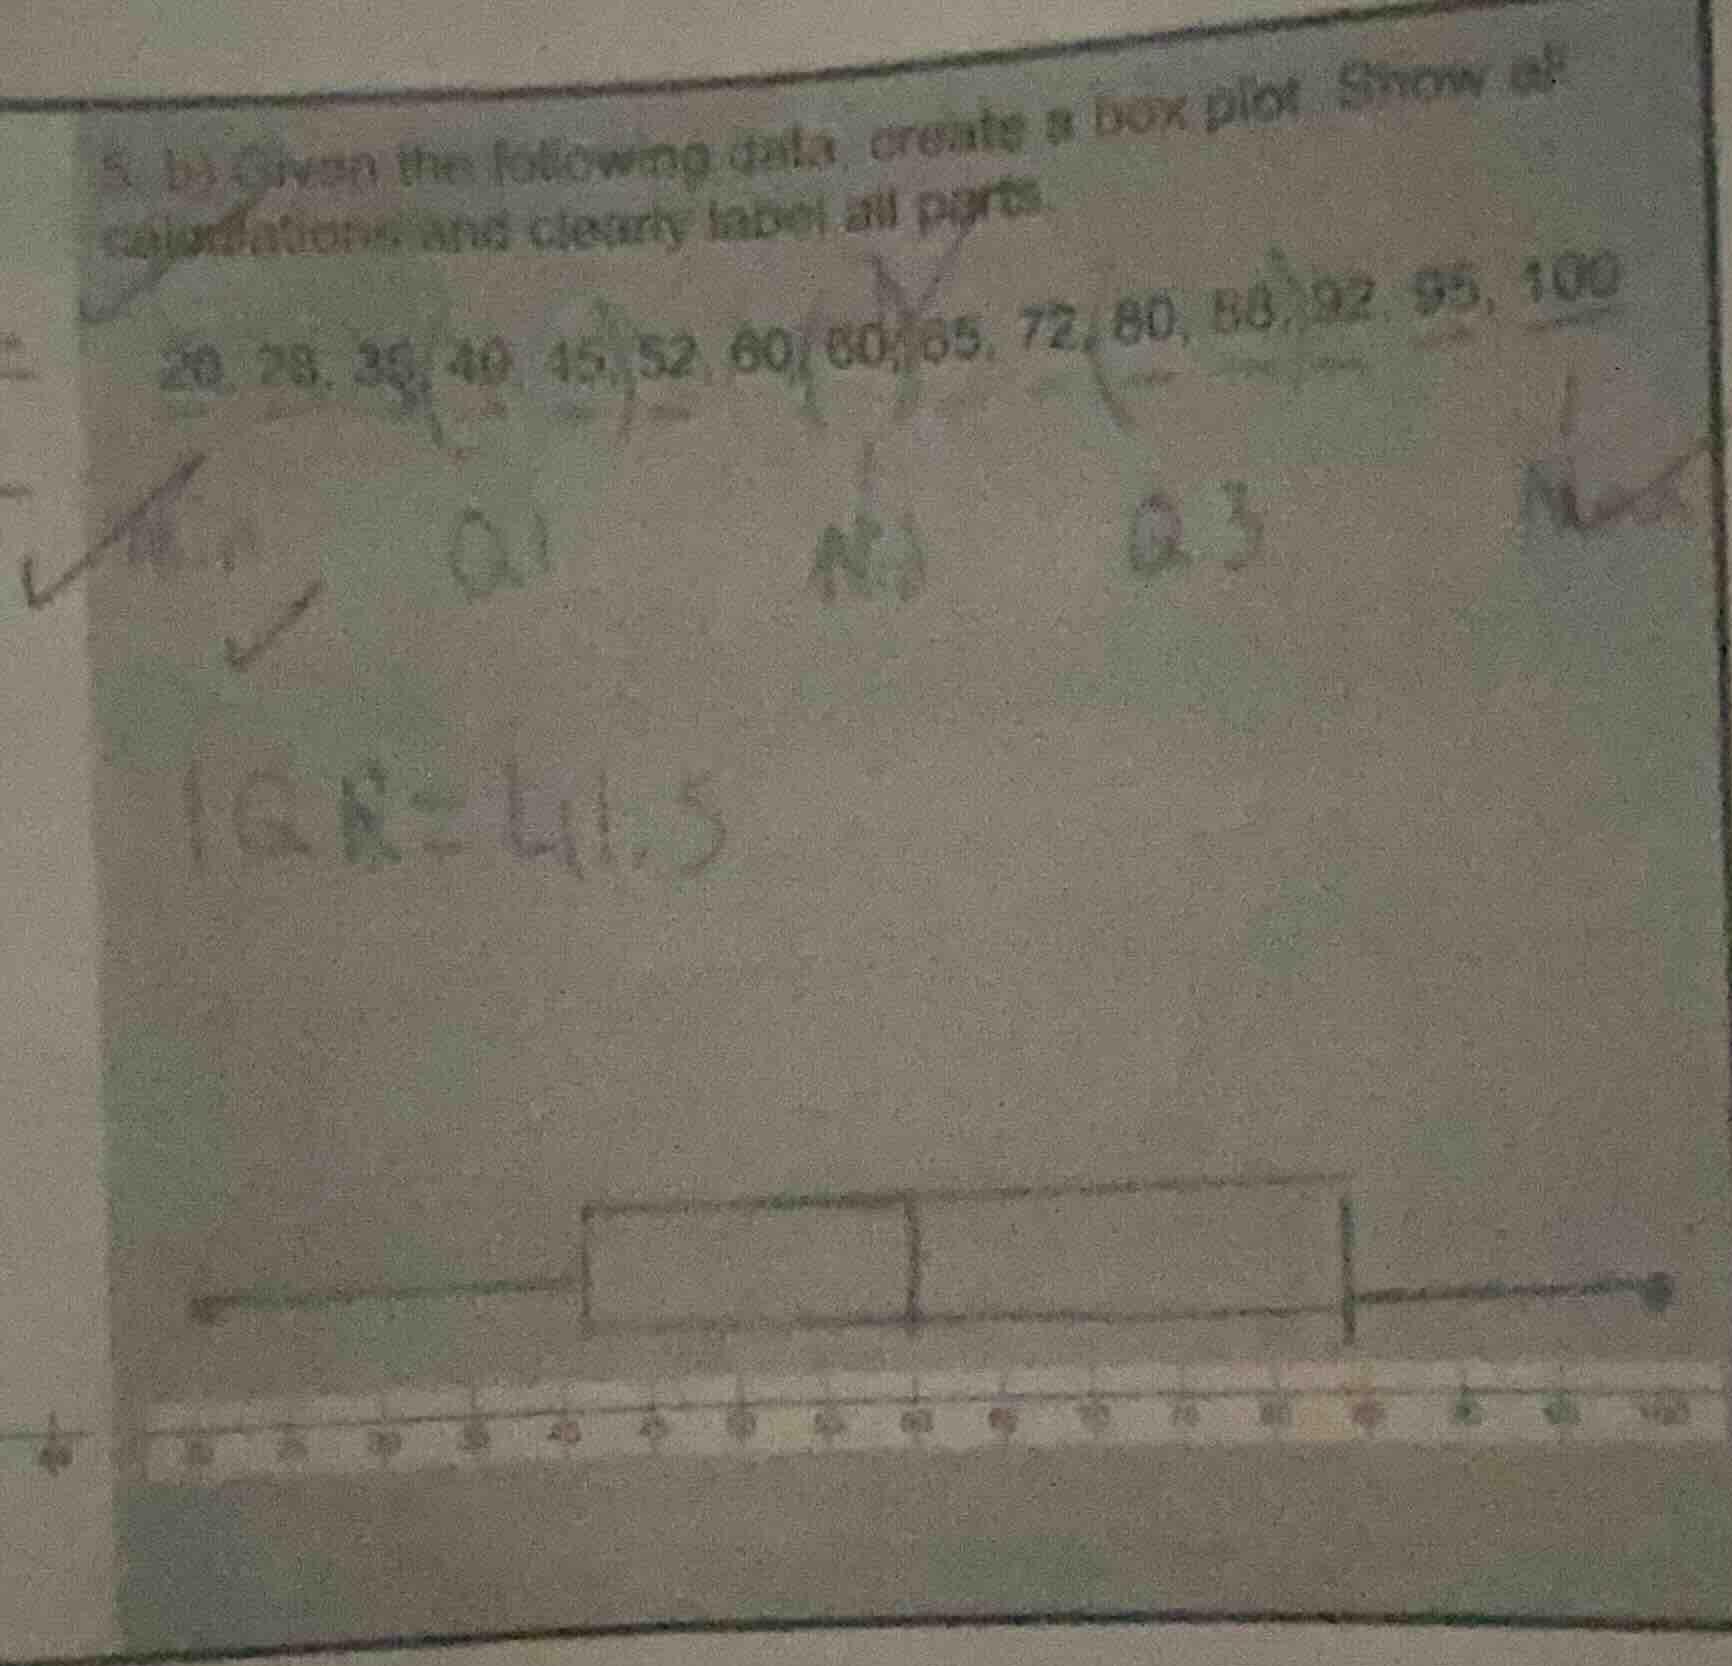
- b) given the following data, create a box plot. show all calculations and clearly label all parts. 20, 28, 35, 40, 45, 52, 60, 60, 65, 72, 80, 90, 92, 95, 100
Step1: Confirm sorted data
Data (already sorted): $20, 28, 35, 40, 45, 52, 60, 60, 65, 72, 80, 88, 92, 95, 100$
Count: $n=15$
Step2: Find minimum and maximum
Minimum ($Min$) = smallest value: $20$
Maximum ($Max$) = largest value: $100$
Step3: Calculate median (Q2)
Median = value at position $\frac{n+1}{2} = \frac{15+1}{2}=8$
8th value: $60$
Step4: Calculate Q1 (lower quartile)
Q1 = median of lower half (first 7 values: $20,28,35,40,45,52,60$)
Position: $\frac{7+1}{2}=4$
4th value: $40$
Step5: Calculate Q3 (upper quartile)
Q3 = median of upper half (last 7 values: $65,72,80,88,92,95,100$)
Position: $\frac{7+1}{2}=4$
4th value: $88$
Step6: Calculate IQR
$IQR = Q3 - Q1 = 88 - 40 = 48$
Step7: Identify outliers (none here)
Lower fence: $Q1 - 1.5\times IQR = 40 - 1.5\times48 = -32$
Upper fence: $Q3 + 1.5\times IQR = 88 + 1.5\times48 = 160$
All data points are within $-32$ to $160$, so no outliers.
Step8: Define box plot components
- Whiskers: Extend from $20$ (min) to $40$ (Q1), and $88$ (Q3) to $100$ (max)
- Box: Spans from $40$ (Q1) to $88$ (Q3), with a line at $60$ (median)

Snap & solve any problem in the app
Get step-by-step solutions on Sovi AI
Photo-based solutions with guided steps
Explore more problems and detailed explanations
Box plot key values:
- Minimum: $20$
- First Quartile (Q1): $40$
- Median (Q2): $60$
- Third Quartile (Q3): $88$
- Maximum: $100$
- Interquartile Range (IQR): $48$
The box plot has:
- A horizontal box from 40 to 88, with a vertical line at 60 (median)
- Left whisker from 20 to 40
- Right whisker from 88 to 100
- No outliers, as all data falls within the range $-32$ to $160$