QUESTION IMAGE
Question
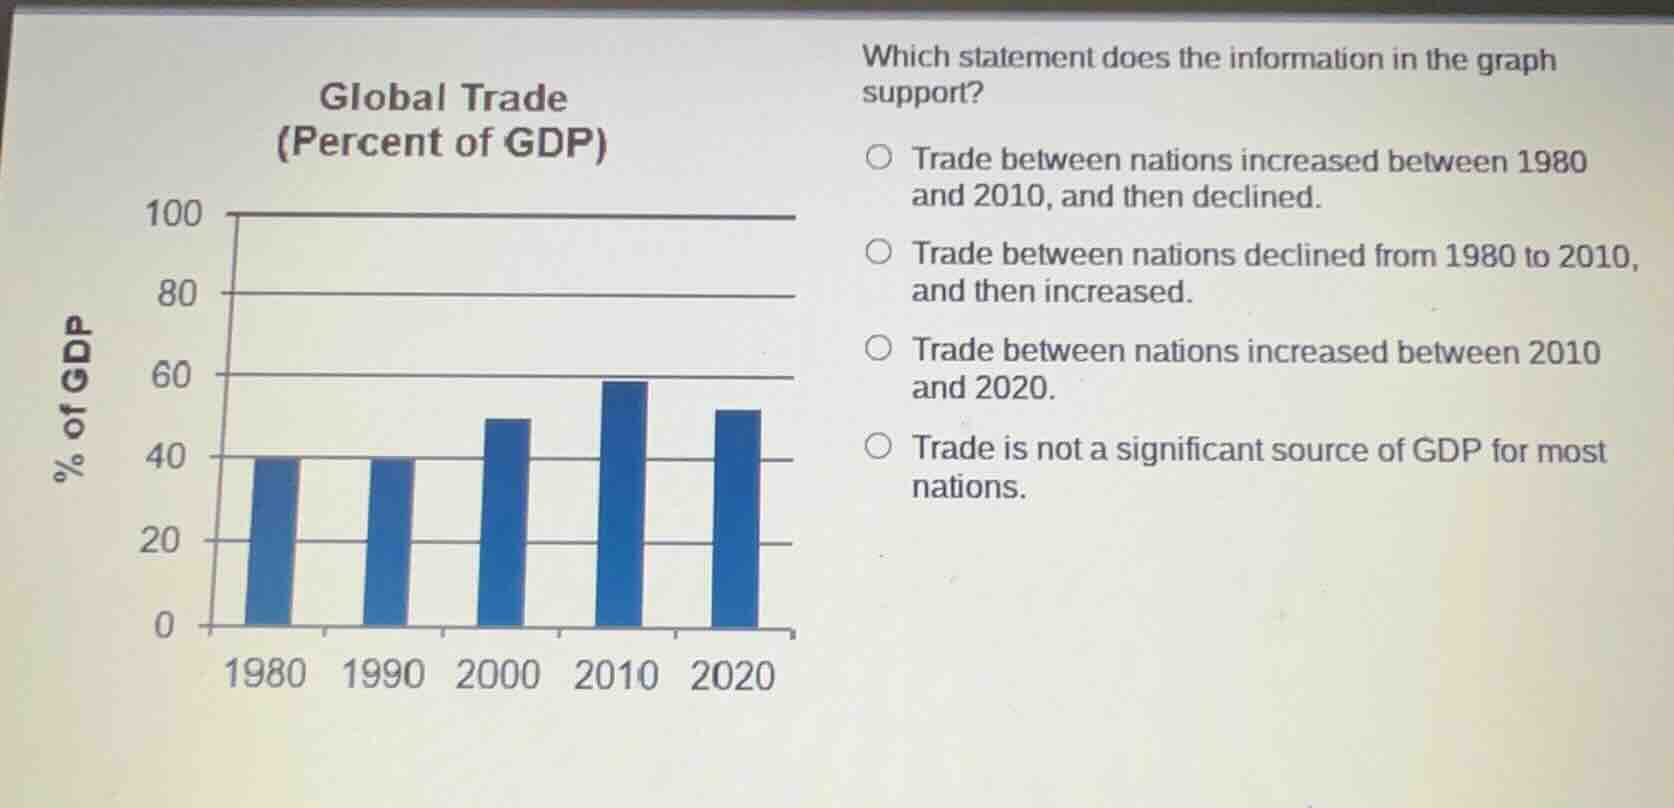
global trade (percent of gdp)
which statement does the information in the graph support?
trade between nations increased between 1980 and 2010, and then declined.
trade between nations declined from 1980 to 2010, and then increased.
trade between nations increased between 2010 and 2020.
trade is not a significant source of gdp for most nations.
Brief Explanations
- Analyze the bar graph:
- 1980: ~40% of GDP
- 1990: ~40% of GDP
- 2000: ~48% of GDP
- 2010: ~59% of GDP
- 2020: ~51% of GDP
- Evaluate each option:
- Option 1: Trade rose 1980-2010, then fell in 2020. This matches the graph data.
- Option 2: Trade did not decline 1980-2010, so this is false.
- Option 3: Trade decreased 2010-2020, so this is false.
- Option 4: Trade makes up 40-59% of GDP, so it is a significant source, making this false.

Snap & solve any problem in the app
Get step-by-step solutions on Sovi AI
Photo-based solutions with guided steps
Explore more problems and detailed explanations
A. Trade between nations increased between 1980 and 2010, and then declined.