QUESTION IMAGE
Question
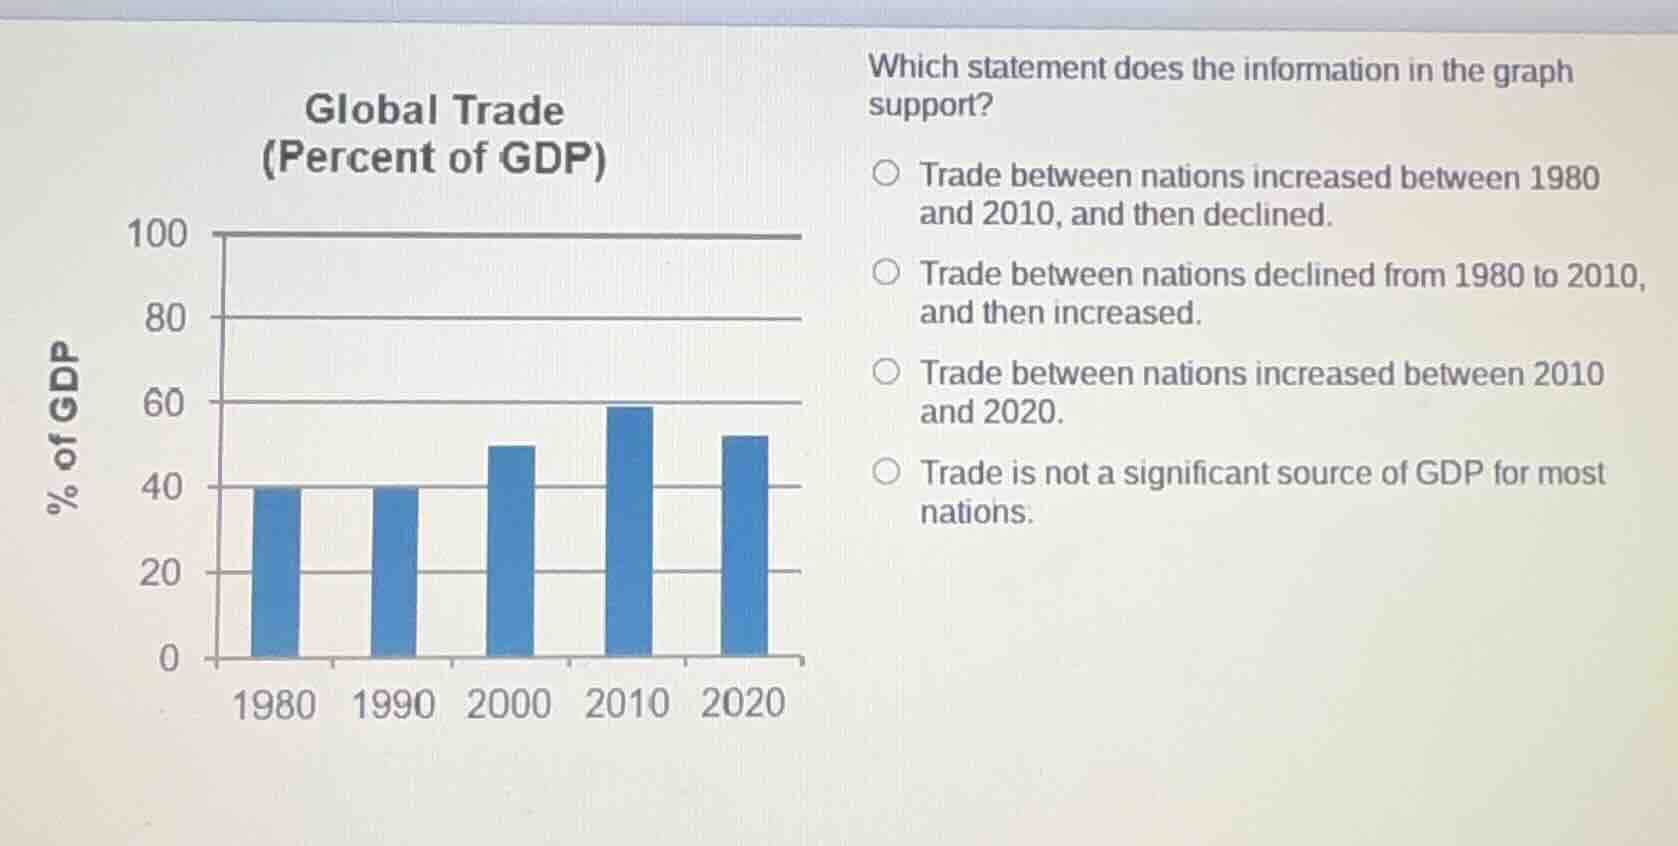
global trade (percent of gdp)
which statement does the information in the graph support?
○ trade between nations increased between 1980 and 2010, and then declined.
○ trade between nations declined from 1980 to 2010, and then increased.
○ trade between nations increased between 2010 and 2020.
○ trade is not a significant source of gdp for most nations.
Brief Explanations
- Analyze the bar graph: 1980 (~40%), 1990 (~40%), 2000 (~50%), 2010 (~60%), 2020 (~52%).
- Evaluate each option:
- Option 1: Trade rose 1980-2010, then fell 2010-2020. This matches the data.
- Option 2: Trade declined 1980-2010: false, it increased.
- Option 3: Trade increased 2010-2020: false, it decreased.
- Option 4: Trade is not significant: false, it makes up 40-60% of GDP.

Snap & solve any problem in the app
Get step-by-step solutions on Sovi AI
Photo-based solutions with guided steps
Explore more problems and detailed explanations
A. Trade between nations increased between 1980 and 2010, and then declined.