QUESTION IMAGE
Question
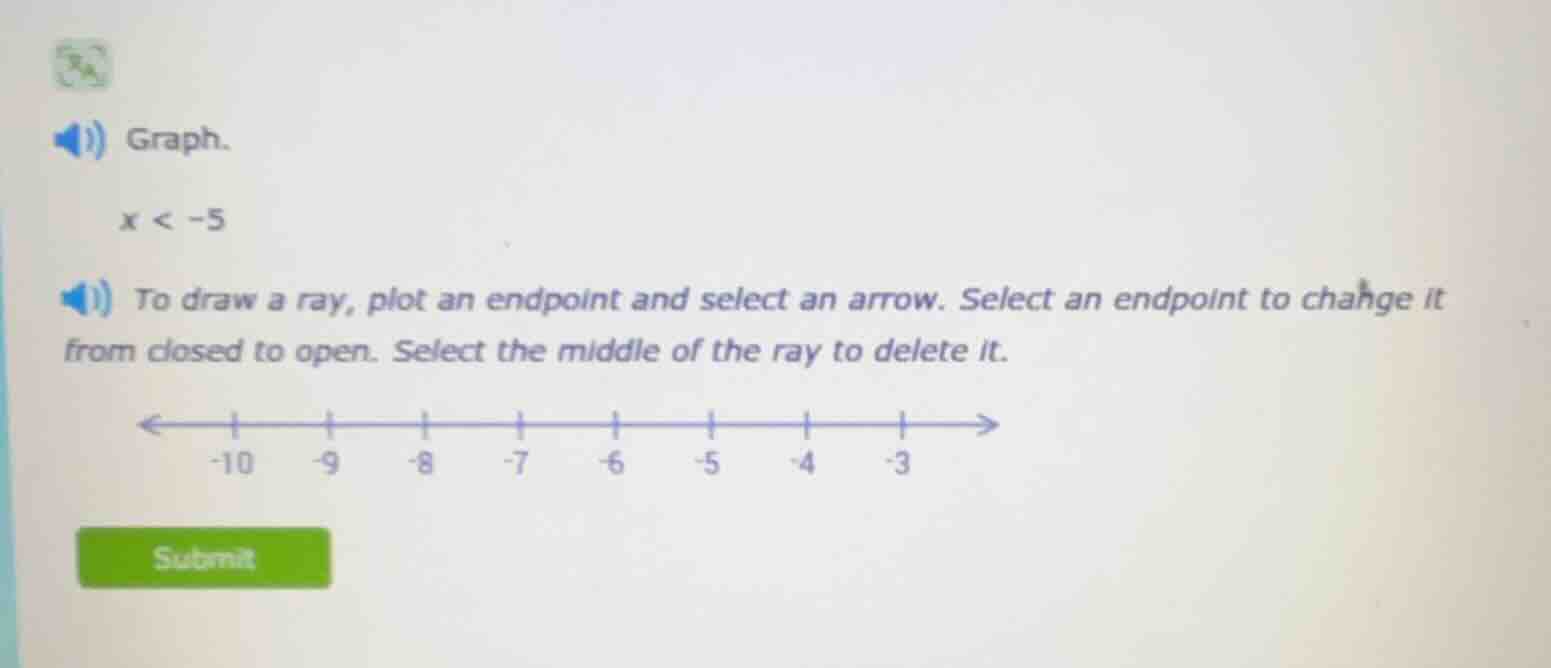
graph.
x < -5
to draw a ray, plot an endpoint and select an arrow. select an endpoint to change it from closed to open. select the middle of the ray to delete it.
-10 -9 -8 -7 -6 -5 -4 -3
Step1: Identify the inequality type
The inequality is \( x < -5 \), which means we need to represent all real numbers less than -5 on the number line. Since the inequality is strict (\(<\), not \(\leq\)), the endpoint at -5 should be an open circle (not filled).
Step2: Determine the direction of the ray
Numbers less than -5 are to the left of -5 on the number line. So we start at -5 (with an open circle) and draw a ray pointing to the left (towards more negative numbers like -6, -7, -8, etc.).

Snap & solve any problem in the app
Get step-by-step solutions on Sovi AI
Photo-based solutions with guided steps
Explore more problems and detailed explanations
To graph \( x < -5 \):
- Plot an open circle (since \( x \) is strictly less than -5, not equal to -5) at \( x = -5 \) on the number line.
- Draw a ray starting from the open circle at -5 and extending to the left (towards \( -\infty \)) to represent all numbers less than -5.