QUESTION IMAGE
Question
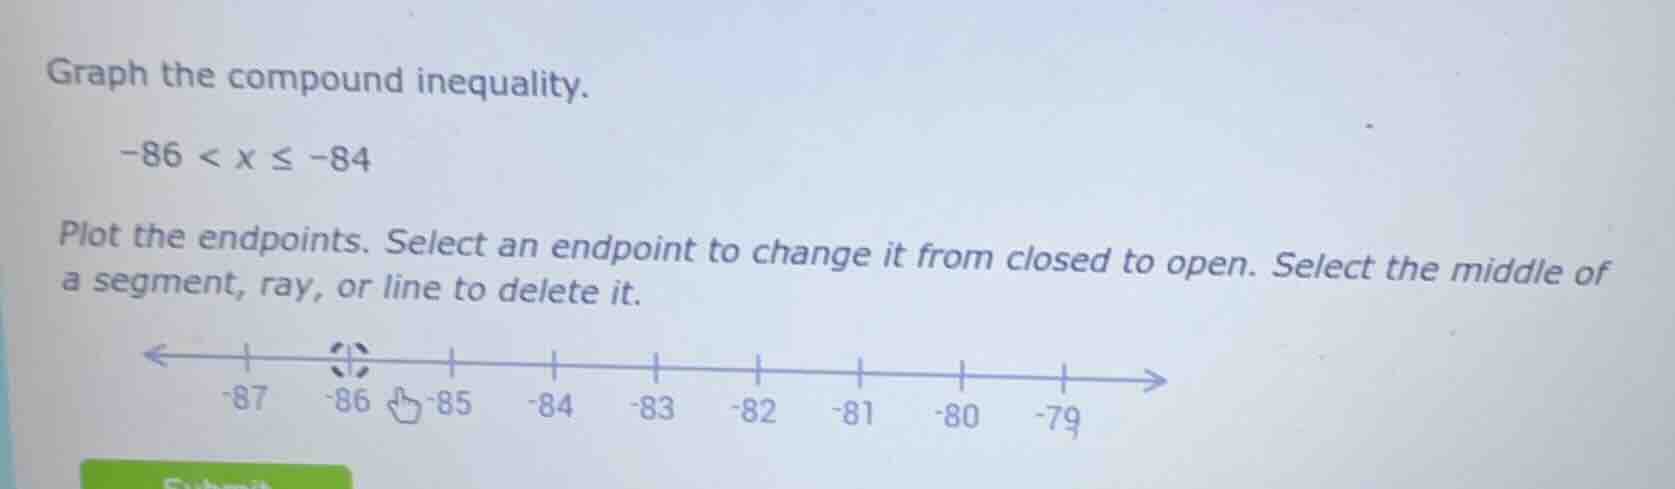
graph the compound inequality.
-86 < x ≤ -84
plot the endpoints. select an endpoint to change it from closed to open. select the middle of a segment, ray, or line to delete it.
Step1: Analyze the inequality \( -86 < x \leq -84 \)
The inequality \( -86 < x \) means \( x \) is greater than -86, so the endpoint at -86 should be open (not included). The inequality \( x \leq -84 \) means \( x \) is less than or equal to -84, so the endpoint at -84 should be closed (included).
Step2: Plot the endpoints on the number line
- For \( x > -86 \), place an open circle at -86.
- For \( x \leq -84 \), place a closed circle at -84.
Step3: Draw the line segment
Draw a line segment connecting the open circle at -86 and the closed circle at -84 to represent all the values of \( x \) that satisfy the compound inequality.

Snap & solve any problem in the app
Get step-by-step solutions on Sovi AI
Photo-based solutions with guided steps
Explore more problems and detailed explanations
To graph \( -86 < x \leq -84 \):
- Place an open circle at \( x = -86 \) (since \( -86 \) is not included in the solution set).
- Place a closed circle at \( x = -84 \) (since \( -84 \) is included in the solution set).
- Draw a line segment connecting the open circle at \( -86 \) and the closed circle at \( -84 \) to show all values of \( x \) between \( -86 \) (not including \( -86 \)) and \( -84 \) (including \( -84 \)).