QUESTION IMAGE
Question
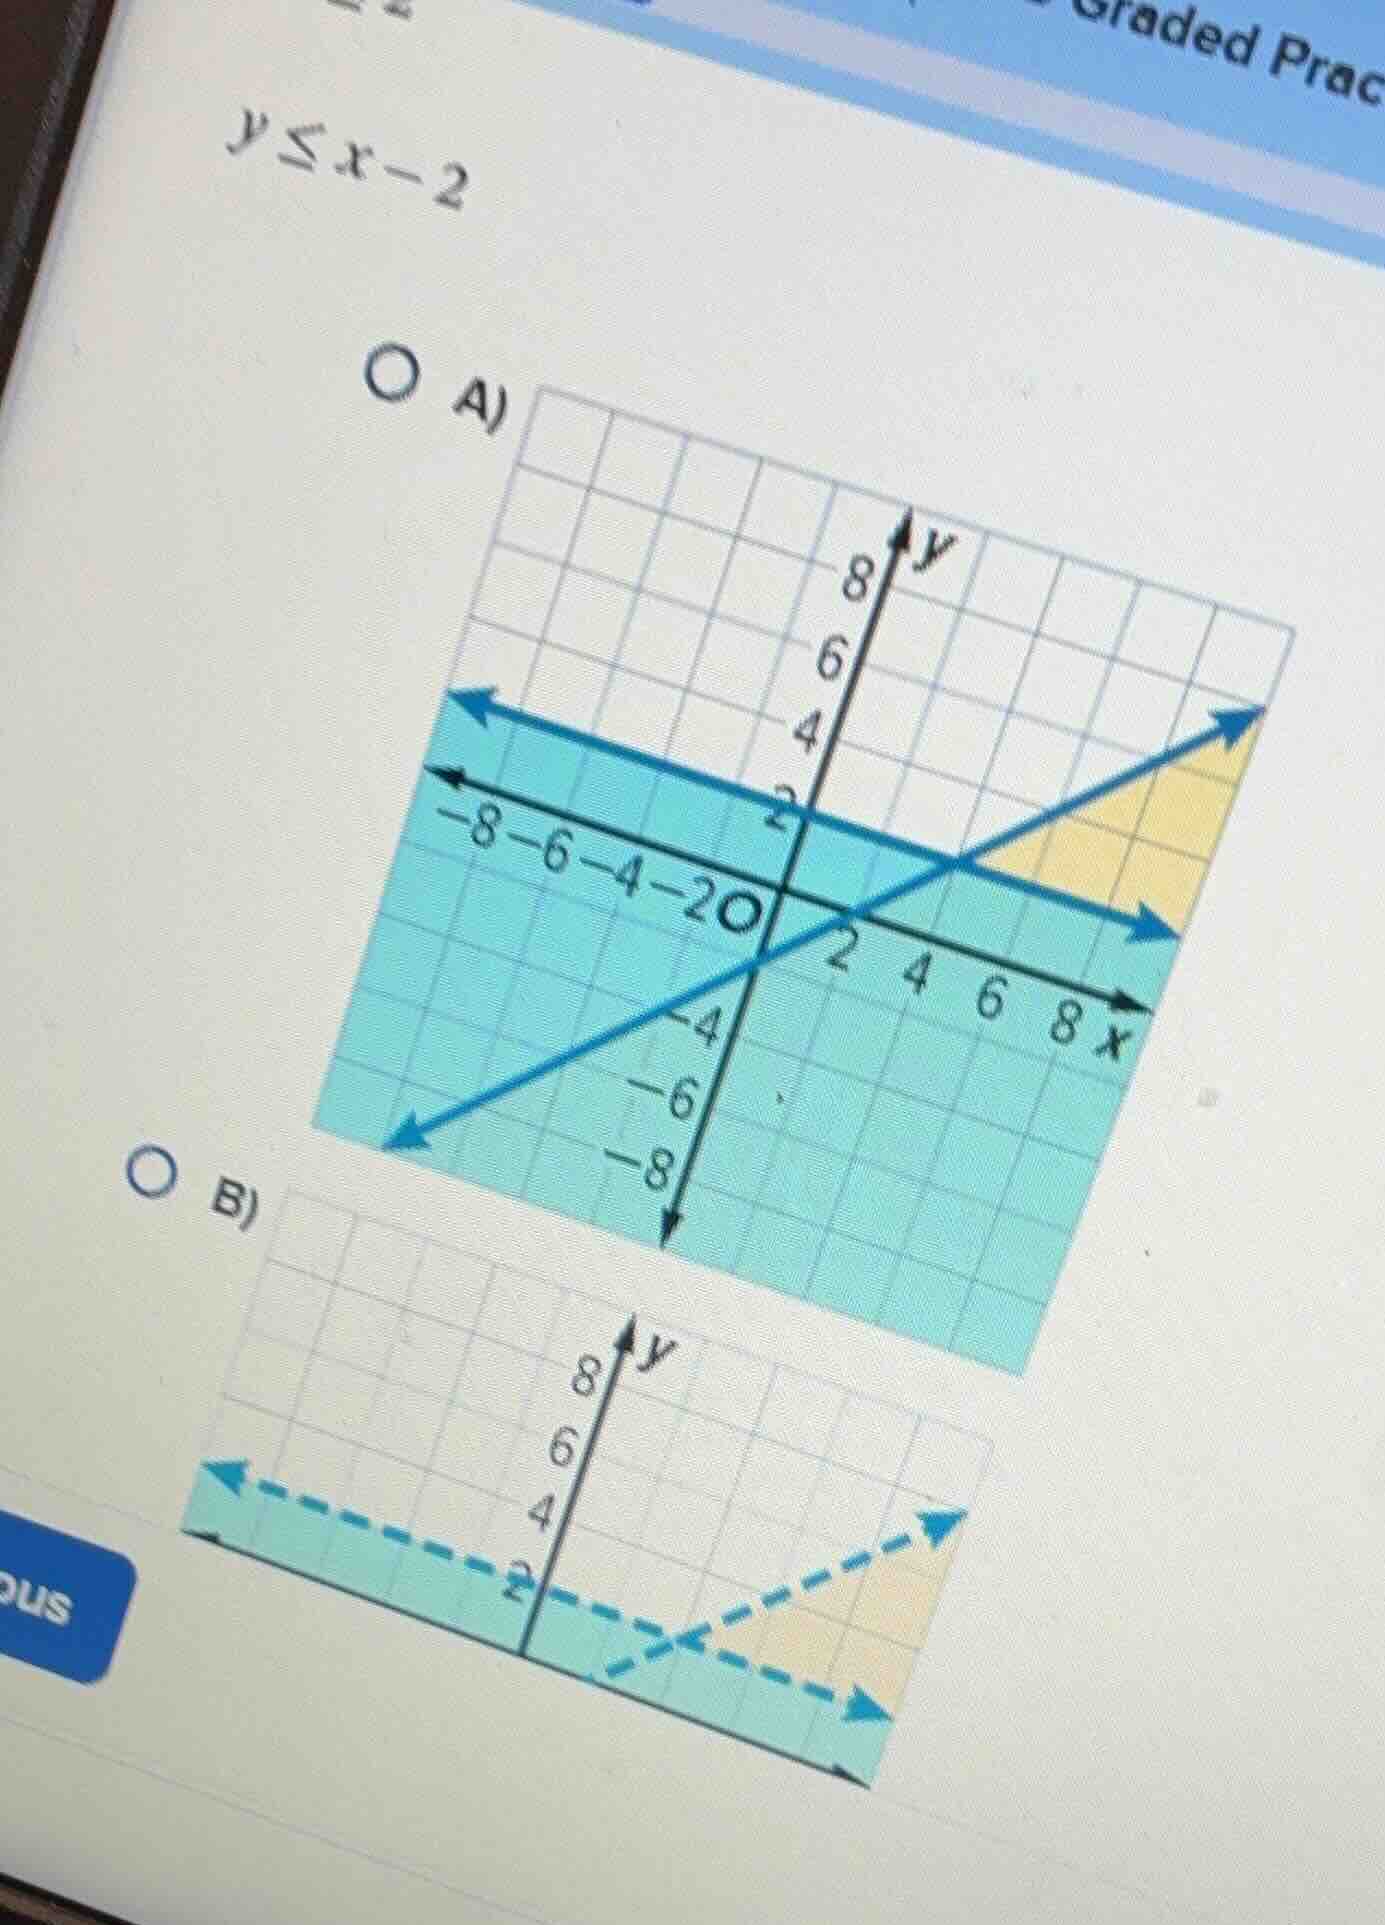
y ≤ x - 2
o a) graph a
o b) graph b
Step1: Analyze the inequality \( y \leq x - 2 \)
The inequality is in slope - intercept form \( y=mx + b \), where the slope \( m = 1 \) and the y - intercept \( b=-2 \). For a linear inequality of the form \( y\leq mx + b \), the boundary line should be solid (because the inequality is "less than or equal to") and we shade the region below the line.
Step2: Analyze Option A
- The boundary line for the line \( y=x - 2 \) has a slope of 1 and a y - intercept of - 2. In option A, the solid line with slope 1 and y - intercept - 2 is drawn correctly. Also, the shading is below the line (since \( y\leq x - 2 \) means we shade the region where \( y \) values are less than or equal to \( x - 2 \)), which matches the inequality.
- For the other line (the horizontal line), it does not affect the inequality \( y\leq x - 2 \) in terms of the correct region for this specific inequality, but the key part is the line \( y = x-2 \) and its shading.
Step3: Analyze Option B
- The boundary line in option B is dashed. But our inequality \( y\leq x - 2 \) should have a solid boundary line (because of the "equal to" part in \( \leq \)), so option B is incorrect.

Snap & solve any problem in the app
Get step-by-step solutions on Sovi AI
Photo-based solutions with guided steps
Explore more problems and detailed explanations
A) The graph with the solid line \( y = x - 2 \) and shading below the line.