QUESTION IMAGE
Question
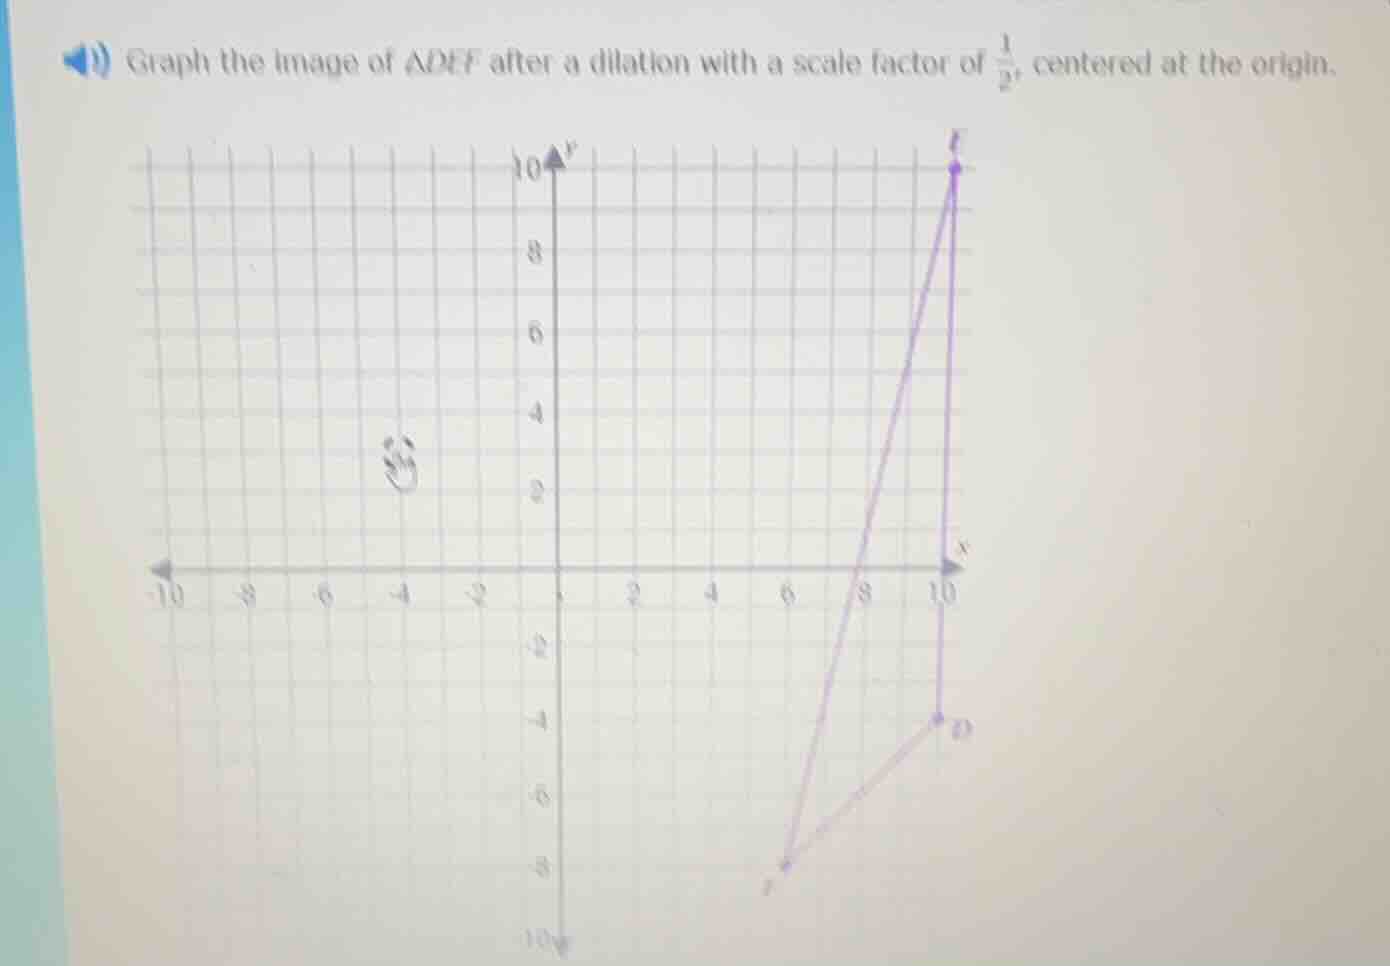
graph the image of $\triangle def$ after a dilation with a scale factor of $\frac{1}{2}$, centered at the origin.
Step1: Identify original coordinates
From the graph:
$D(10, -4)$, $E(10, 10)$, $F(6, -8)$
Step2: Apply dilation formula
For a dilation centered at the origin with scale factor $k=\frac{1}{2}$, the new coordinates $(x', y')$ are given by $(x', y')=(k \cdot x, k \cdot y)$
- For $D$: $x'=\frac{1}{2} \cdot 10=5$, $y'=\frac{1}{2} \cdot (-4)=-2$ → $D'(5, -2)$
- For $E$: $x'=\frac{1}{2} \cdot 10=5$, $y'=\frac{1}{2} \cdot 10=5$ → $E'(5, 5)$
- For $F$: $x'=\frac{1}{2} \cdot 6=3$, $y'=\frac{1}{2} \cdot (-8)=-4$ → $F'(3, -4)$
Step3: Plot and connect new points
Plot $D'(5, -2)$, $E'(5, 5)$, $F'(3, -4)$ on the grid, then connect the points to form $\triangle D'E'F'$.

Snap & solve any problem in the app
Get step-by-step solutions on Sovi AI
Photo-based solutions with guided steps
Explore more problems and detailed explanations
The coordinates of the dilated triangle are $D'(5, -2)$, $E'(5, 5)$, $F'(3, -4)$. When plotted and connected, this forms the image of $\triangle DEF$ after the dilation.