QUESTION IMAGE
Question
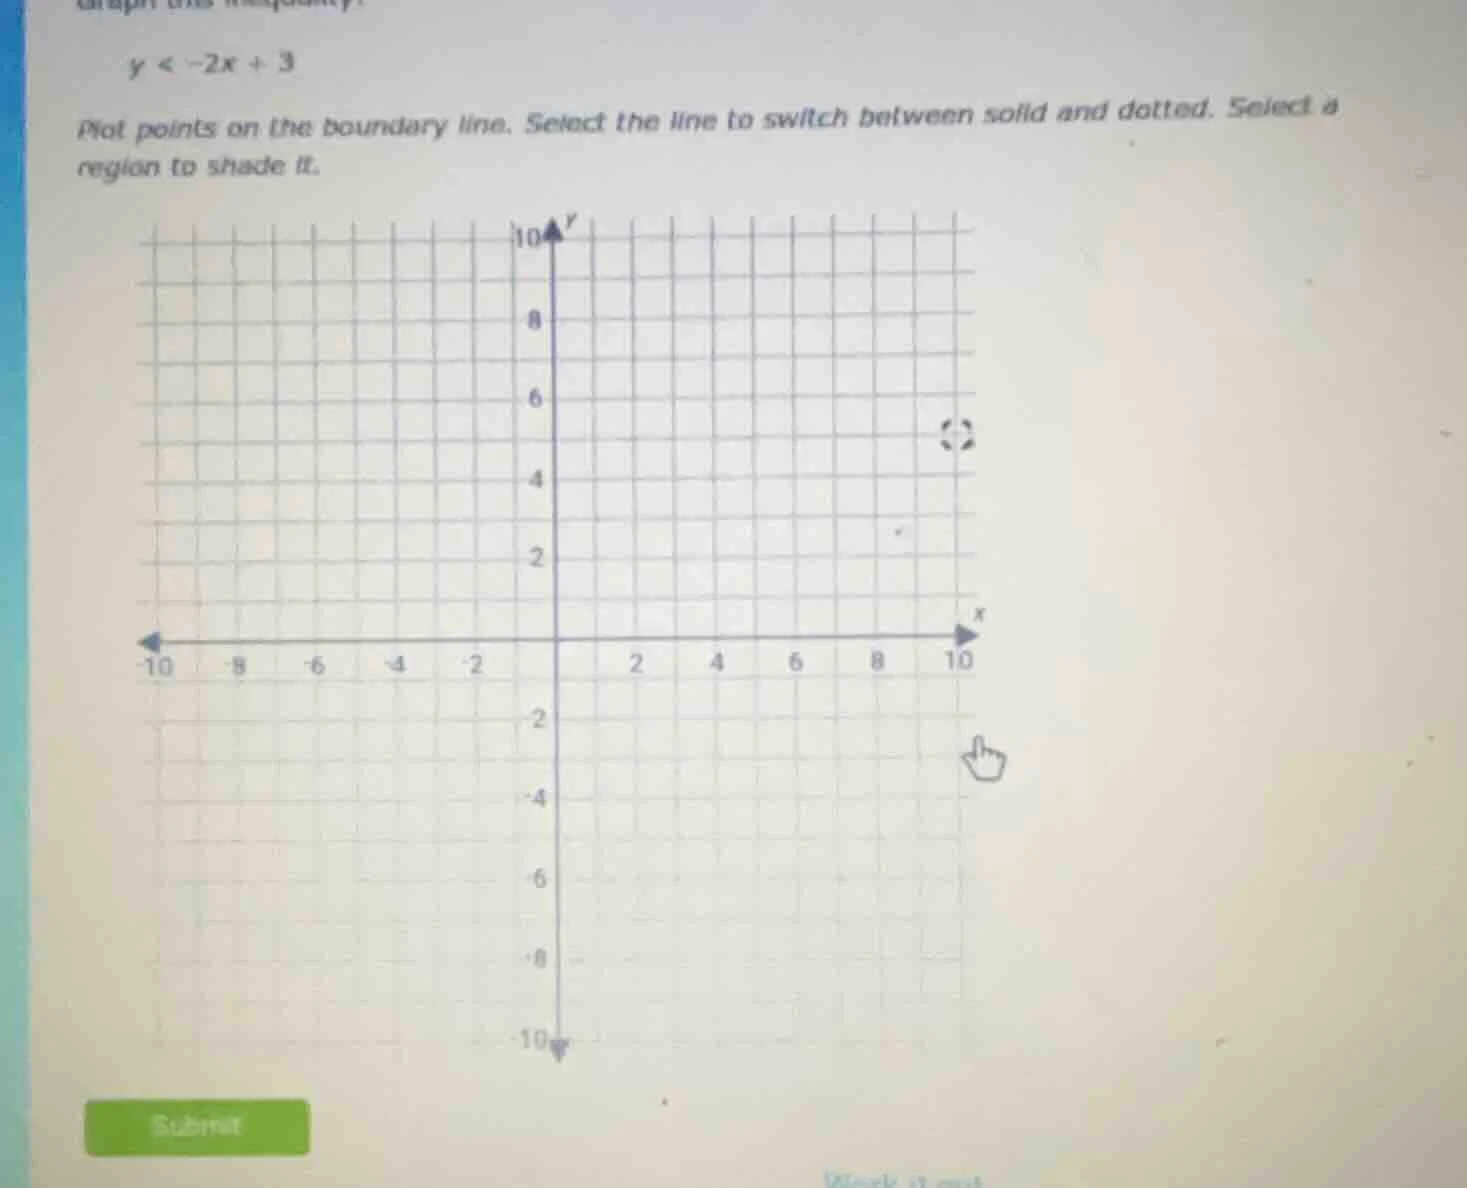
graph this inequality: ( y < -2x + 3 )
plot points on the boundary line. select the line to switch between solid and dotted. select a region to shade it.
Step1: Identify the boundary line type
The inequality is \( y < -2x + 3 \). Since the inequality is strict (\(<\), not \(\leq\)), the boundary line \( y = -2x + 3 \) should be a dotted line.
Step2: Find two points on the boundary line
For the line \( y = -2x + 3 \):
- When \( x = 0 \), \( y = -2(0)+3 = 3 \). So one point is \( (0, 3) \).
- When \( x = 1 \), \( y = -2(1)+3 = 1 \). So another point is \( (1, 1) \). Plot these two points and draw a dotted line through them.
Step3: Determine the shading region
To find which side to shade, test a point not on the line. Let's use the origin \( (0, 0) \).
Substitute \( x = 0 \), \( y = 0 \) into the inequality \( y < -2x + 3 \):
\( 0 < -2(0)+3 \)
\( 0 < 3 \), which is true. So we shade the region that includes the origin (below the dotted line \( y = -2x + 3 \)).

Snap & solve any problem in the app
Get step-by-step solutions on Sovi AI
Photo-based solutions with guided steps
Explore more problems and detailed explanations
- Draw a dotted line through points \((0, 3)\) and \((1, 1)\) (or other points on \(y = -2x + 3\)).
- Shade the region below the dotted line (the region containing \((0, 0)\)).