QUESTION IMAGE
Question
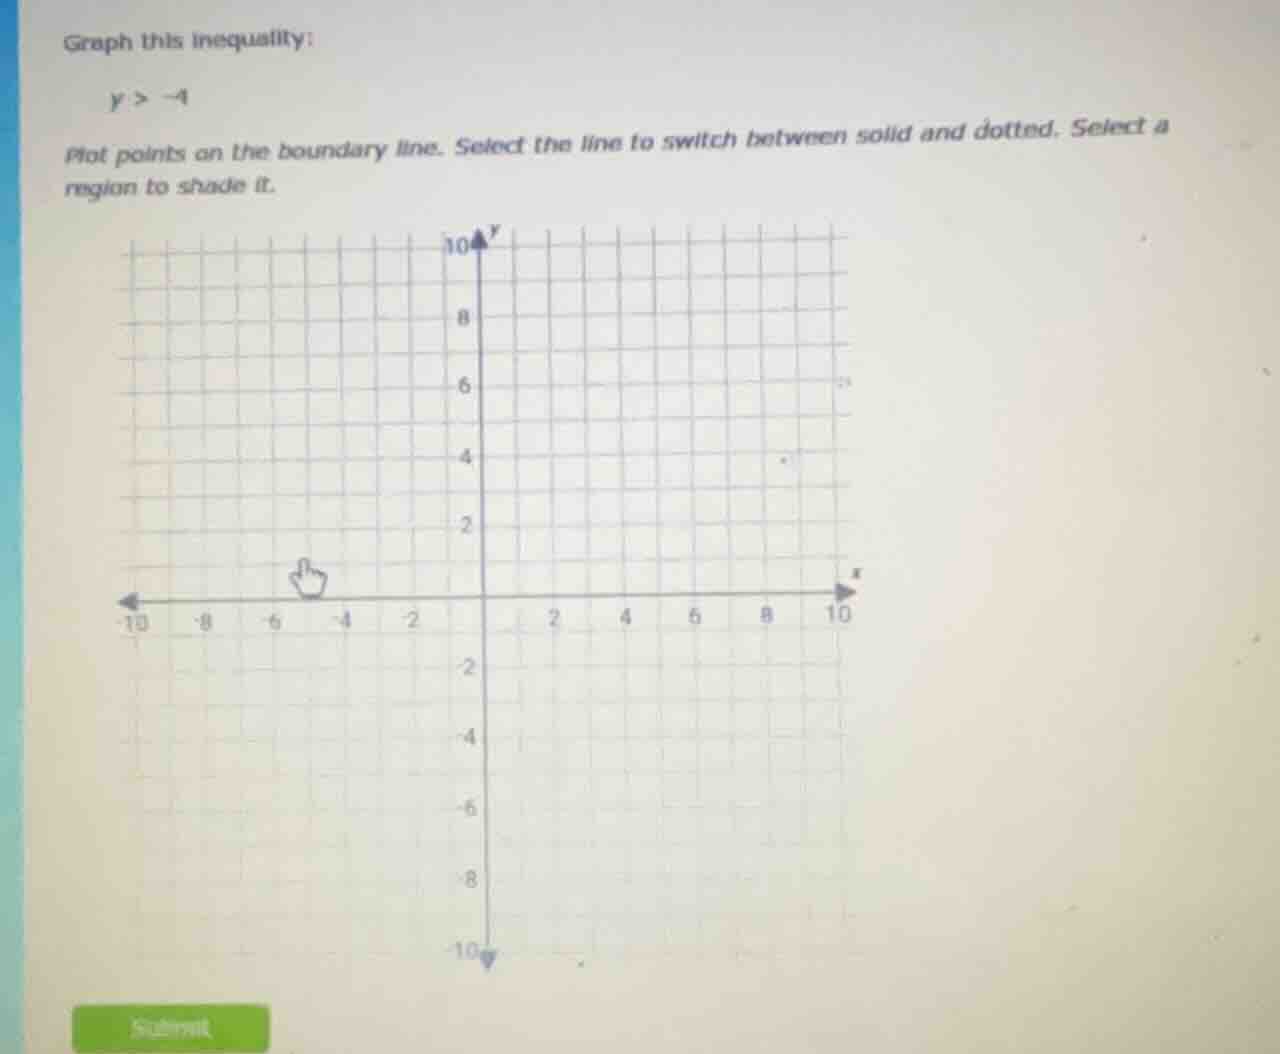
graph this inequality:
y > -4
plot points on the boundary line. select the line to switch between solid and dotted. select a region to shade it.
Step1: Identify the boundary line
The inequality is \( y > -4 \). The boundary line is \( y = -4 \), which is a horizontal line. Since the inequality is \( > \) (not \( \geq \)), the line should be dotted.
Step2: Plot the boundary line
On the coordinate plane, find the line where \( y = -4 \). This is a horizontal line passing through all points with \( y \)-coordinate -4 (e.g., (-10, -4), (-5, -4), (0, -4), (5, -4), (10, -4), etc.). Plot these points and draw a dotted line through them.
Step3: Determine the region to shade
We need to shade the region where \( y > -4 \). This is the region above the line \( y = -4 \) (since for any point in this region, the \( y \)-value is greater than -4). So, shade the area above the dotted line \( y = -4 \).

Snap & solve any problem in the app
Get step-by-step solutions on Sovi AI
Photo-based solutions with guided steps
Explore more problems and detailed explanations
- Draw a dotted horizontal line \( y = -4 \) (passing through points like \((x, -4)\) for any \( x \)).
- Shade the region above this dotted line (where \( y > -4 \)).